Despite this, it remains unclear as to whether these traders are prophetic in their anticipation of a price fall or if their very presence in the market scares off all other investors.
With all this in mind, we created a list of companies on the Standard & Poor 500 index that have been experiencing the highest levels of short sales as a percentage of share float. They have also been increasing their short positions month over month. In other words, short-sellers are extremely pessimistic about their future prospects.
Here are our parameters for the list:
– Short float over 15%
– Increased short covering month over month
– Listed on the S&P 500 index
These 6 stocks made the list:
1. Cliffs Natural Resources Inc. (CLF, Earnings, Analysts, Financials): Produces iron ore pellets, lump and fines iron ore, and metallurgical coal products. Market cap at $5.2B. Float short: 21.09%. Shares shorted have increased from 27.49M to 29.78M over the last month, an increase which represents about 1.62% of the company’s float of 141.13M shares. Days to cover ratio at 3.87 days.
2. First Solar, Inc. (FSLR, Earnings, Analysts, Financials): Manufactures and sells solar modules using a thin-film semiconductor technology. Market cap at $2.08B. Float short: 49.71%. Shares shorted have increased from 28.59M to 29.80M over the last month, an increase which represents about 2.01% of the company’s float of 60.06M shares. Days to cover ratio at 3.88 days.
3. J. C. Penney Company, Inc. (JCP, Earnings, Analysts, Financials): Through its subsidiary, operates department stores in the United States and Puerto Rico. Market cap at $5.58B. Float short: 33.45%. Shares shorted have increased from 56.53M to 59.80M over the last month, an increase which represents about 2.04% of the company’s float of 160.47M shares. Days to cover ratio at 7.26 days.
4. Netflix, Inc. (NFLX, Earnings, Analysts, Financials): Provides subscription based Internet services for TV shows and movies in the United States and internationally. Market cap at $3.87B. Float short: 29.87%. Shares shorted have increased from 15.57M to 16.21M over the last month, an increase which represents about 1.18% of the company’s float of 54.21M shares. Days to cover ratio at 3.16 days.
5. Pitney Bowes Inc. (PBI, Earnings, Analysts, Financials): Provides mail processing equipment and integrated mail solutions worldwide. Market cap at $2.88B. Float short: 30.29%. Shares shorted have increased from 56.20M to 60.60M over the last month, an increase which represents about 2.2% of the company’s float of 200.03M shares. Days to cover ratio at 18.5 days.
6. Safeway Inc. (SWY, Earnings, Analysts, Financials): Operates as a food and drug retailer in North America. Market cap at $3.92B. Float short: 32.16%. Shares shorted have increased from 73.54M to 76.38M over the last month, an increase which represents about 1.2% of the company’s float of 237.00M shares. Days to cover ratio at 12.23 days.
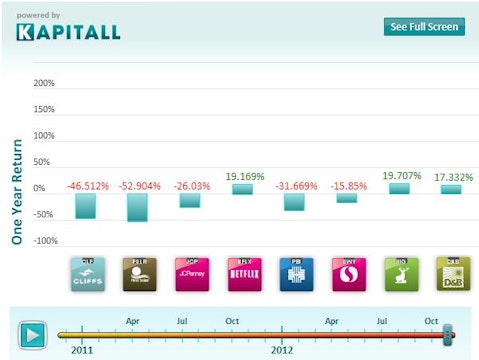
Notable runners up: The following two stocks have short floats in the 10-15% range. Interestingly, according to the one-year return chart above these are the only heavily shorted S&P stocks with a positive anual performance.
7. Hartford Financial Services Group Inc. (HIG, Earnings, Analysts, Financials): Provides insurance and financial services in the United States and internationally. Market cap at $9.46B. Float short: 10.87%. Shares shorted have increased from 36.66M to 44.81M over the last month, an increase which represents about 2.02% of the company’s float of 403.97M shares. Days to cover ratio at 5.81 days.
8. Dun & Bradstreet Corp. (DNB, Earnings, Analysts, Financials): Provides commercial information and insight on businesses worldwide. Market cap at $3.66B. Float short: 11.09%. Shares shorted have increased from 4.41M to 4.96M over the last month, an increase which represents about 1.3% of the company’s float of 42.15M shares. Days to cover ratio at 8.89 days.
Kapitall’s Rebecca Lipman owns shares of FSLR. Short data sourced from Yahoo! Finance and Finviz.
Analyze These Ideas: Getting Started
- Read descriptions for all companies mentioned
- Access a performance overview for all stocks in the list
- Compare analyst ratings for the companies mentioned
- Compare analyst ratings to annual returns for stocks mentioned
- Real-Time Opinion: Scan the latest tweets about these companies (feed will open in a new window)
Dig Deeper: Access Company Snapshots, Charts, Filings
- Cliffs Natural Resources Inc. (CLF, Chart, Download SEC Filings)
- First Solar, Inc. (FSLR, Chart, Download SEC Filings)
- J. C. Penney Company, Inc. (JCP, Chart, Download SEC Filings)
- Netflix, Inc. (NFLX, Chart, Download SEC Filings)
- Pitney Bowes Inc. (PBI, Chart, Download SEC Filings)
- Safeway Inc. (SWY, Chart, Download SEC Filings)
- Hartford Financial Services Group Inc. (HIG, Chart, Download SEC Filings)
- Dun & Bradstreet Corp. (DNB, Chart, Download SEC Filings)
This article was originally written by Rebecca Lipman, and posted on Kapitall.


