In a recent SEC report, it was officially announced that Google Inc (NASDAQ:GOOG)’s ex-CEO, Eric Schmidt would be selling over a third (nearly 42%) of his total equity share in Google.
“On November 15, 2012, Eric E. Schmidt, Google Inc (NASDAQ:GOOG)’s Executive Chairman of the Board of Directors, adopted a stock trading plan in accordance with the guidelines specified in Rule 10b5-1 under the Securities Exchange Act of 1934, as amended, and Google’s Policy Against Insider Trading. In February 2013, sales of Eric’s Google Inc (NASDAQ:GOOG) stock may commence under this trading plan.”
We are talking about the 10b5-1 trading plan here that allows a company insider to buy or sell company stocks at the time of non-possession of material non-public information (MNPI). The 10b5-1 trading plan basically maintains that insider stock transactions should not affect the stock market positively or negatively. That is why the plan commences well after the announcement of the Q4F12 and FY12 last month.

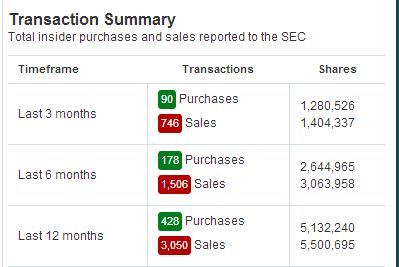
The total number of insider purchases has been far lower than the total number of insider sales. Why is so? Is there anything brewing underneath? Is it a matter of shifting risks on each other’s shoulders?

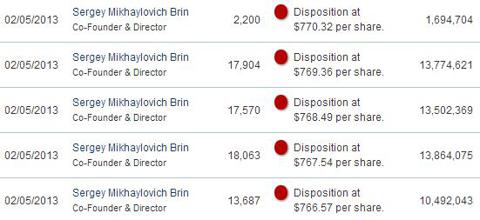
Even SergeyBrin, one of the internet giant’s co-founders, has been actively divesting his shares at a steady rate, as it seems from the image below.

When the founders are selling stakes in the company, you have to look up and notice. Does this prove anything though? No. To know what might be going on inside, we have to peer through the “open windows” – the company press releases.
Digging Deeper Into The Financials
Here are a few highlights from the latest financial statements that might interest you as an investor:
1). Huge Unwarranted Cash Balance – When a company, even after purchasing another company for $12.5 billion in cash, still has cash balance of $14.8 billion left in the asset account, there might not be a reason to worry. But when you see that coupled with increasing investment in marketable and non-marketable securities (going well over $34.8 billion as of December 31st, 2012), you might wonder whether the company is not being able to find suitable avenues to invest. We all know that Google Inc (NASDAQ:GOOG) has been showing signs of maturity (as every tech company does), even though it operates in one of the most dynamic industries out there. If I do not hear any news of the “next big thing” in a quarter or two, SergeyBrin‘s action and subsequently, Eric Schmidt’s plan to do the same will hint at something else.
2). Huge Intangibles and Goodwill – When your intangibles and goodwill increase by over $9 billion in a year, you get scared because you wonder whether these numbers are bloated or not. Remember how Seagate had to write off over $2.3 billion as impairment charge over acquisition of Maxtor in 2009. And who can forget how the $5.1 billion impairment charge by Macy’s in 2008? When I see too high a goodwill increase, the very first thing that comes to my mind is whether the company can justify for it. You pay a premium only when you know you can justify for the over-valuation with increased free cash flow and increased operating margins in the future.
3). Retained Earnings – When retained earnings surges to $48.3 billion in 2012 from $37.6 billion in 2011 (up by over $10 billion), one is curious about what the company is doing with the money. With no dividend payout and loads of cash sitting in the coffer of the company, does it not sound like the food being wasted in the fridge rather than being eaten early? We go back to the same proposition – unless Google shows us any “new” signs of business improvement, stowing away money for future use does not really matter. Remember, we need to factor in the time value of money as well.
4). Motorola Mobility Profit – Total revenue from the Motorola Mobility segment was reportedly $4.14 billion, with total costs/expenses recorded at $3.5 billion in 2012. That is a gross margin of over 18%, not bad indeed! But gross income from the segment resulted to only $640 million. Doing the math, we would need 19.5 years to gain the return of total investment of $12.5 billion. That’s too long a time to even think about. If Google wants to show Motorola Mobility as a viable investment, Google should focus more on improving the ‘synergy’ of operations. Yes, the unauditedYoY consolidated revenue growth of 32% (including revenue from Motorola Mobility) does satisfy me since the investment was done only halfway through 2012. But what about total YoY Google revenues last year, apart from that from Motorola Mobility? That stands at 21%, compared to the 2010-11 revenue growth and 2009-2010 revenue growth stand at 29% and 24% respectively. Not very inspiring, right? Needless to say, Google is under strong pressure to perform and show the reason behind its investment in Motorola Mobility and how it is integrable with Google’s future business strategy.
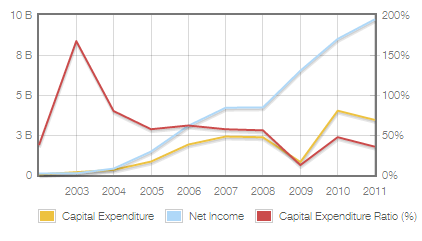
5). Purchase of PPE – When you are spending over $3 billion every year on plant, property and equipment, it should show in strategic growth in revenue and thus, net income margin of the company. When net income from continuing operations increased by 22% YoY in 2012, what concerns me is that it is steadily decreasing compared to 26% in 2011 and 29% in 2010. Is Google slowing down? If so, the only thing that will happen is that the PE multiple of 24 will fall down to industry average of 20. And that means subsequent fall in Google’s share price.

The table below is self-explanatory. Google’s return on average assets (ROAA) of 12.71% is pretty low compared to 28.49% of Baidu.com, Inc. (ADR) (NASDAQ:BIDU) and 20.42% of Microsoft Corporation (NASDAQ:MSFT). Its current ratio of 4.22 is pretty much in line with 4.38 of Yahoo! and 4.21 of Baidu. Microsoft Corporation (NASDAQ:MSFT) and AOL, Inc. (NYSE:AOL) seem to be efficiently reutilizing their working capital and that shows in their high gross margins. In short, Google’s inefficient asset utilization (given by lower ROAA and higher current ratio) might be dragging the profit margin down, which will ultimately readjust the PE ratio down to the industry average of 20.
In other words, if we are looking for an alternative to Google right now, Microsoft, with its broad economic moat and strong financials seems to be the perfect choice to me.
| Companies | Price-to-Earnings Ratio | Price-to-Sales Ratio | Current Ratio | Return on Average Assets | Gross Margin |
| 23.98 | 4.48 | 4.22 | 12.71 | 56.91 | |
| 20.09 | 8.31 | 4.21 | 28.49 | 77.95 | |
| Yahoo! | 6.32 | 4.49 | 4.38 | 2.67 | 69.38 |
| Microsoft | 15.18 | 2.68 | 2.81 | 20.42 | 73.47 |
| AOL | 3.24 | 1.17 | 1.74 | 4.77 | 27.48 |
| 1905.74 | 10.70 | 10.71 | 1.65 | 74.89 |
Just on a sidenote, Facebook Inc (NASDAQ:FB) with the incredibly HIGH P/E multiple and the lowest ROAA seems to be in a dangerously bloated state to me. Facebook investors, you should watch out.
Foolish Bottom line
Google is giving mixed signals from an investor’s point of view. With not-so-impressive ratios, weak fundamentals (By “fundamentals”, I mean “business strategy, asset allocation and execution” mainly) and insider selling of shares, Google stock price is at the edge of a cliff. The only thing that can help Google maintain the present market valuation is quality earnings’ growth in the coming few quarters. If investors see enough growth, they will keep the Google shares or else, move on to better growth or dividend pastures.
And that, my friend, might result into a downslide of the stock price. Remember how Apple’s price crumbled down over the last few weeks. It’s better to be safe than sorry.
The article Should You Follow Eric Schmidt and Sell Google Shares? originally appeared on Fool.com and is written by Suman Chatterjee.
Copyright © 1995 – 2013 The Motley Fool, LLC. All rights reserved. The Motley Fool has a disclosure policy.


