“I’m a confidence man. I give people confidence, they give me their money.” – Marius Josipovic, Sneaky Pete, Season 1, Episode 1
When it comes to investment products, nothing sells as quick as the possibility of quick profits. The Dalal Street understands this phenomenon all too well. It is no surprise then that investment advisors and investment product salesmen are quick to whip out numbers like a 16% annual return from Indian stock markets. In this article, we show why you should not place much confidence in such assertions.

Q1 2020 hedge fund letters, conferences and more
Be careful of simplistic thinking and authoritarian aura
A few years ago, Baijnath visited the offices of an investment advisor. This person had a board behind his desk showing the progression of BSE Sensex every ten years. His big idea – Sensex goes up five times every ten years! Who knows, maybe his expectation of Sensex reaching 100,000 by 2020 still has enough time to turn out to be right.
This kind of simplistic analysis is dangerous to your wealth. However, when combined with an aura of knowledge, frequently created by throwing about idioms and sayings, it gets the commissions flowing for the advisor. As Marius’s quote highlighted, it gives people confidence.
However, this raises a few questions that any rational investor should have. For example, where did those numbers come from? Are they grounded in economic outcomes? Do they represent the return we should expect? Or are they just plain baloney?
The Year 1979: That special year
The first thing to note about that return of 16% is that it not incorrect. Just as for a joke to be funny, it has to use some version of a truth, for a lie to be believable, it has to be based upon the truth. As Marius Josipovic said[1], “The trick is, you use the truth when you wanna tell a lie.”
Between April 1979 and March 2015, BSE Sensex grew at a compounded rate of 14.9% p.a.[2] That’s the truth that the myth of Indian stock market’s return of 15%+ is based upon. However, as we discuss, this is an incorrect number to rely upon as it ignores the big economic reset that the Indian economy experienced in 1991. Table 1 shows the decade-wise performance of the BSE Sensex since April 1, 1979. As is seen, the first two decades were associated with much higher performance than the next two. Importantly, much of the high performance of the second decade was driven by the period until 1991; the pre-liberalization period.
Table 1: Sensex – Decade Wise Returns Since April 1979
Source: Bombay Stock Exchange[3], MAEG’s calculations
The Year 1992: The correct start date for Nifty 50 index and other Indian equities
When calculating the rate of growth of any time series that has a variable rate of growth, both the choice of the starting as well as the ending point has a significant influence on the rate of growth derived. The reason why Dalal Street chooses that arbitrary start date as being in 1979 is because it yields a higher rate of growth. However, as we list below, there are several reasons to ignore the equity market returns in the period before 1992.
#1. The Sensex itself didn’t exist in 1979. It was launched in January 1986[4]. If we calculate the return from January 1986 to March 2020, the full period return drops to 12.1%. This compares to 14.9% annual return when calculated from 1979 onwards; a rather significant drop of nearly three percentage points.
#2. The Securities Exchange Board of India (SEBI) was established in April 1992[5].
#3. The process of liberalization of the Indian economy started in 1991 with the IMF and the World Bank bailing out the Indian Government in December 1991. Table 2 shows the pre and post liberalization returns for the Sensex. The differences are rather stark. During the pre-liberalization period of 1979 to 1991, Sensex rose by a factor of 19 times; a rather stunning move in a timeframe of just about 13 years. This equated to an annualized return of 26.0%.
However, the returns since then have been lower by a magnitude of more than half. In the period starting from 1992, a timeframe of nearly 28 years, the Sensex rose by about 15 times; a lower total increase than the pre-liberalization era, and in nearly twice the time. The annualized returns; a much more muted 10.2%.
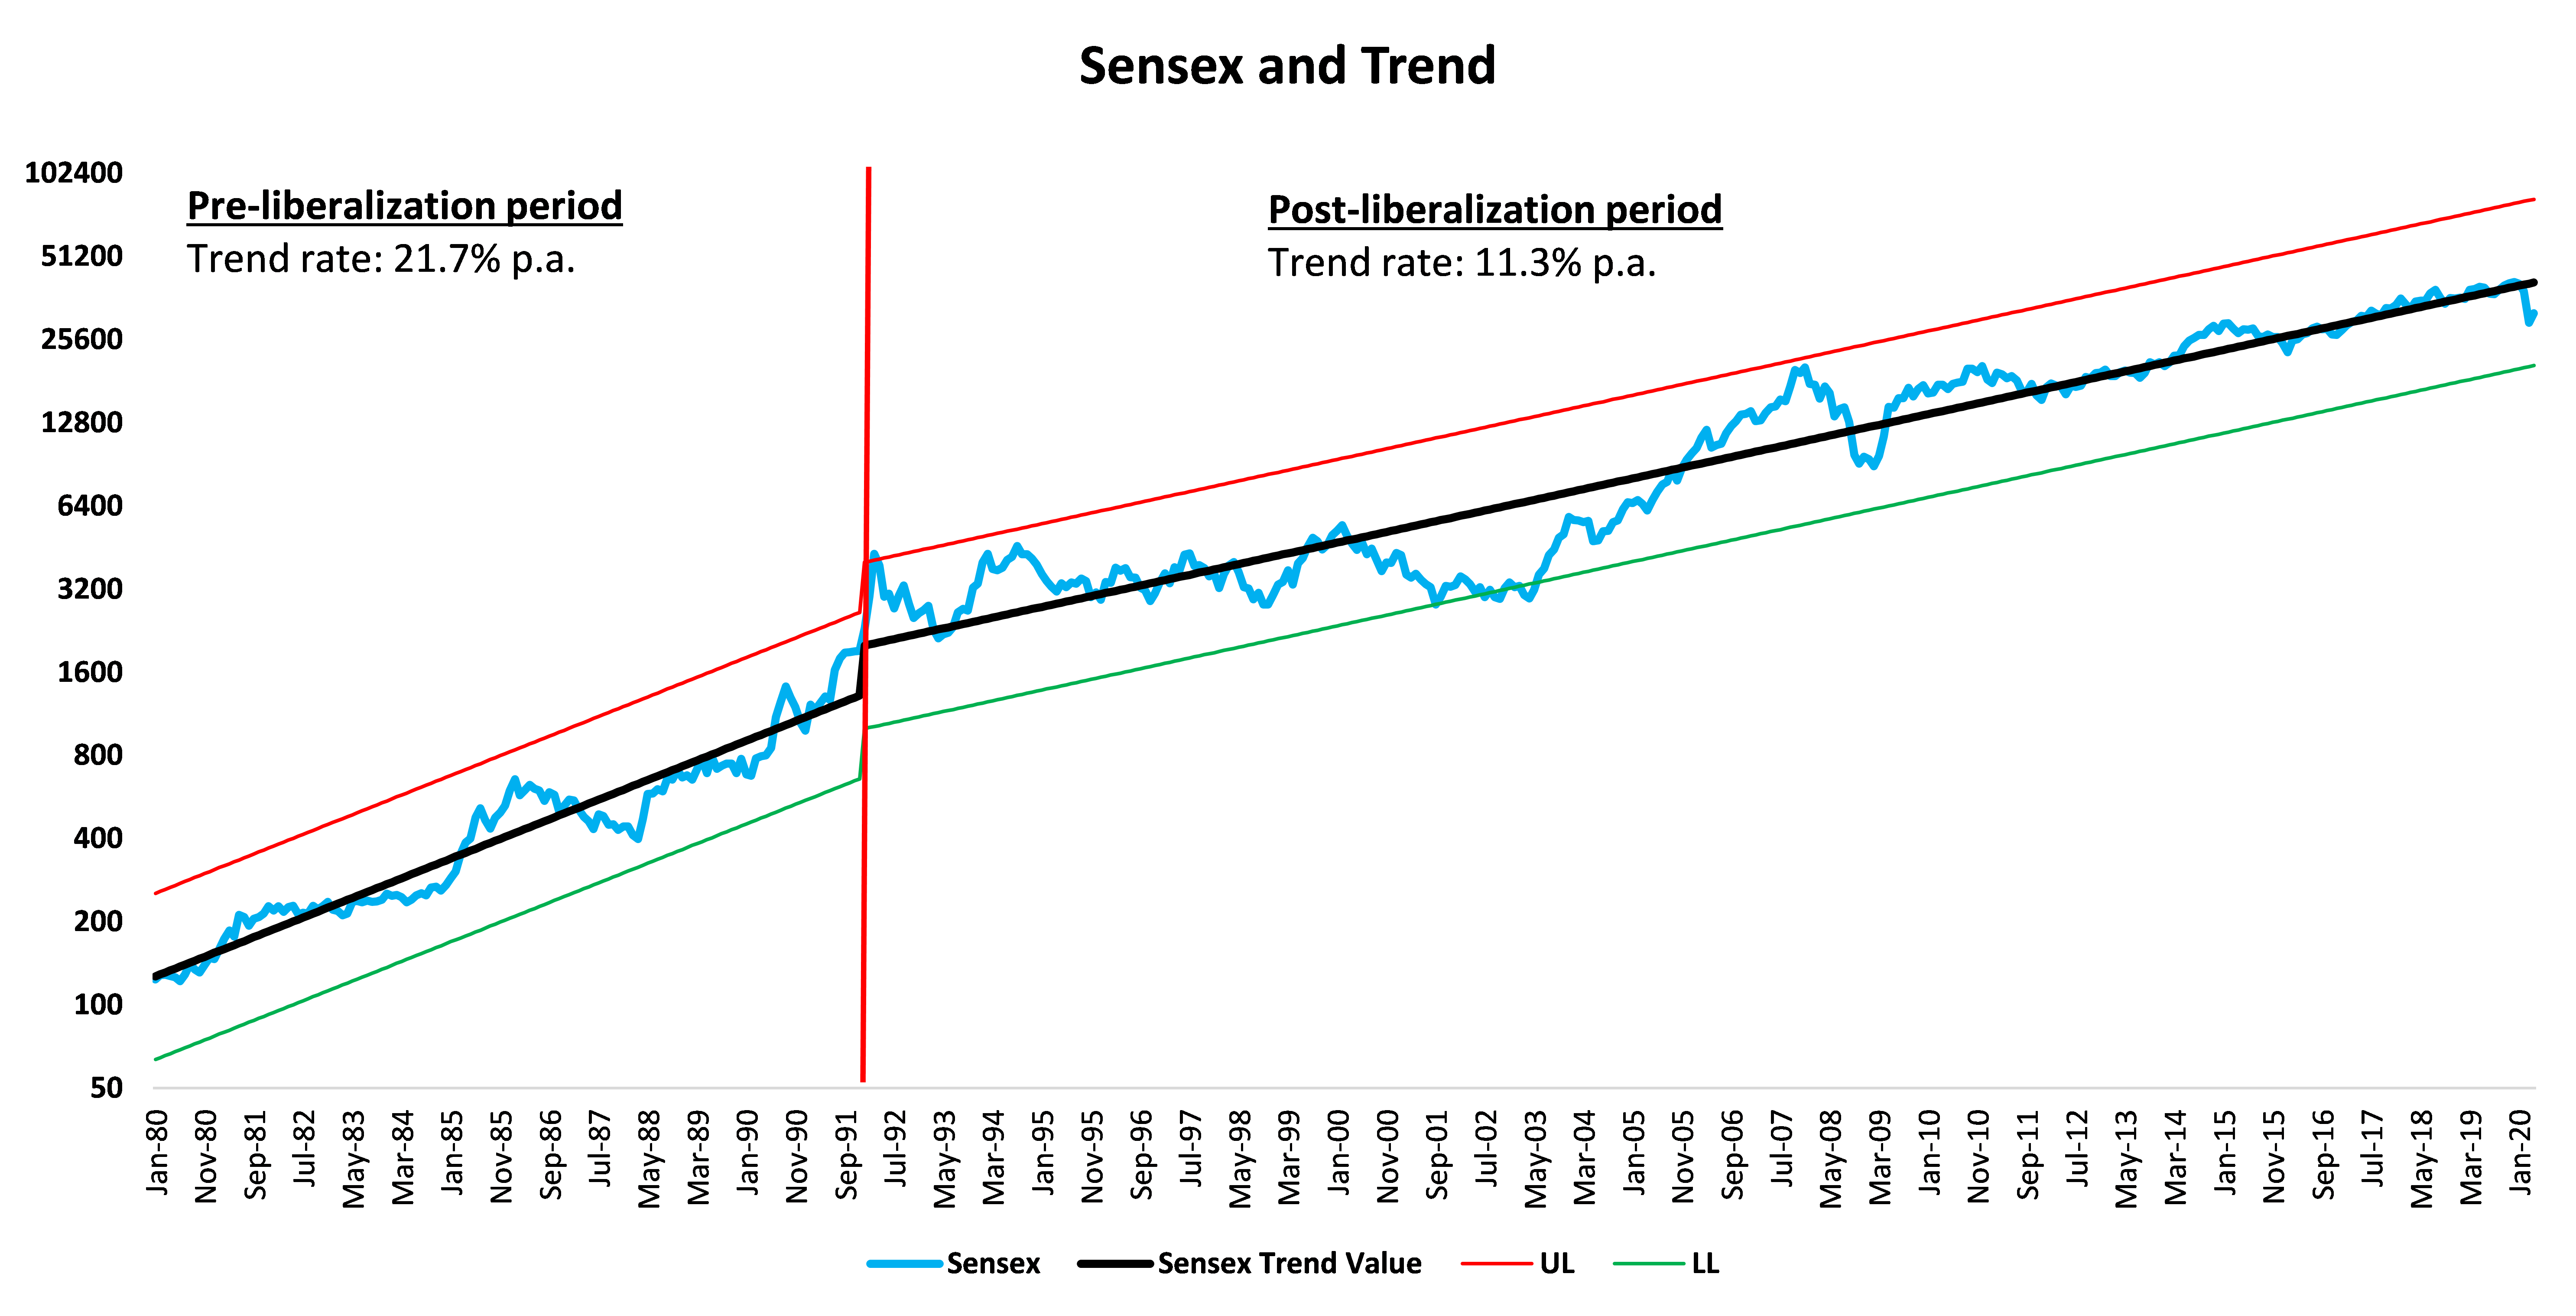
As discussed previously, the rate of annualized return calculation process is affected by the choice of start and end dates. Equity markets do not go up in a straight line. Instead, they fluctuate around their trend values; at times, in extreme zones. The appropriate way to approximate the “underlying” rate of change is to instead use trend values. In Table 2, the last column reports the annualized trend rate which is different from the CAGR for the two time periods. The post-liberalization period is associated with an annual trend rate of 11.3%.
Table 2: Sensex – Pre-Liberalization and Post-Liberalization Returns
Source: Bombay Stock Exchange[6], MAEG’s calculations
As the common adage goes, a picture is worth a thousand words. And so is the picture below. Figure 1 shows the Sensex since 1979 along with the trend value as well as our upper limit and lower limit bands around the trend value. As is highlighted by the vertical red line, the trajectory of the trend shifted downwards post 1991.
Figure 1: Sensex, Trend Values, and Upper and Lower Limits
Source: Bombay Stock Exchange[7], MAEG’s calculations
NIFTY 50 Index – Since inception performance
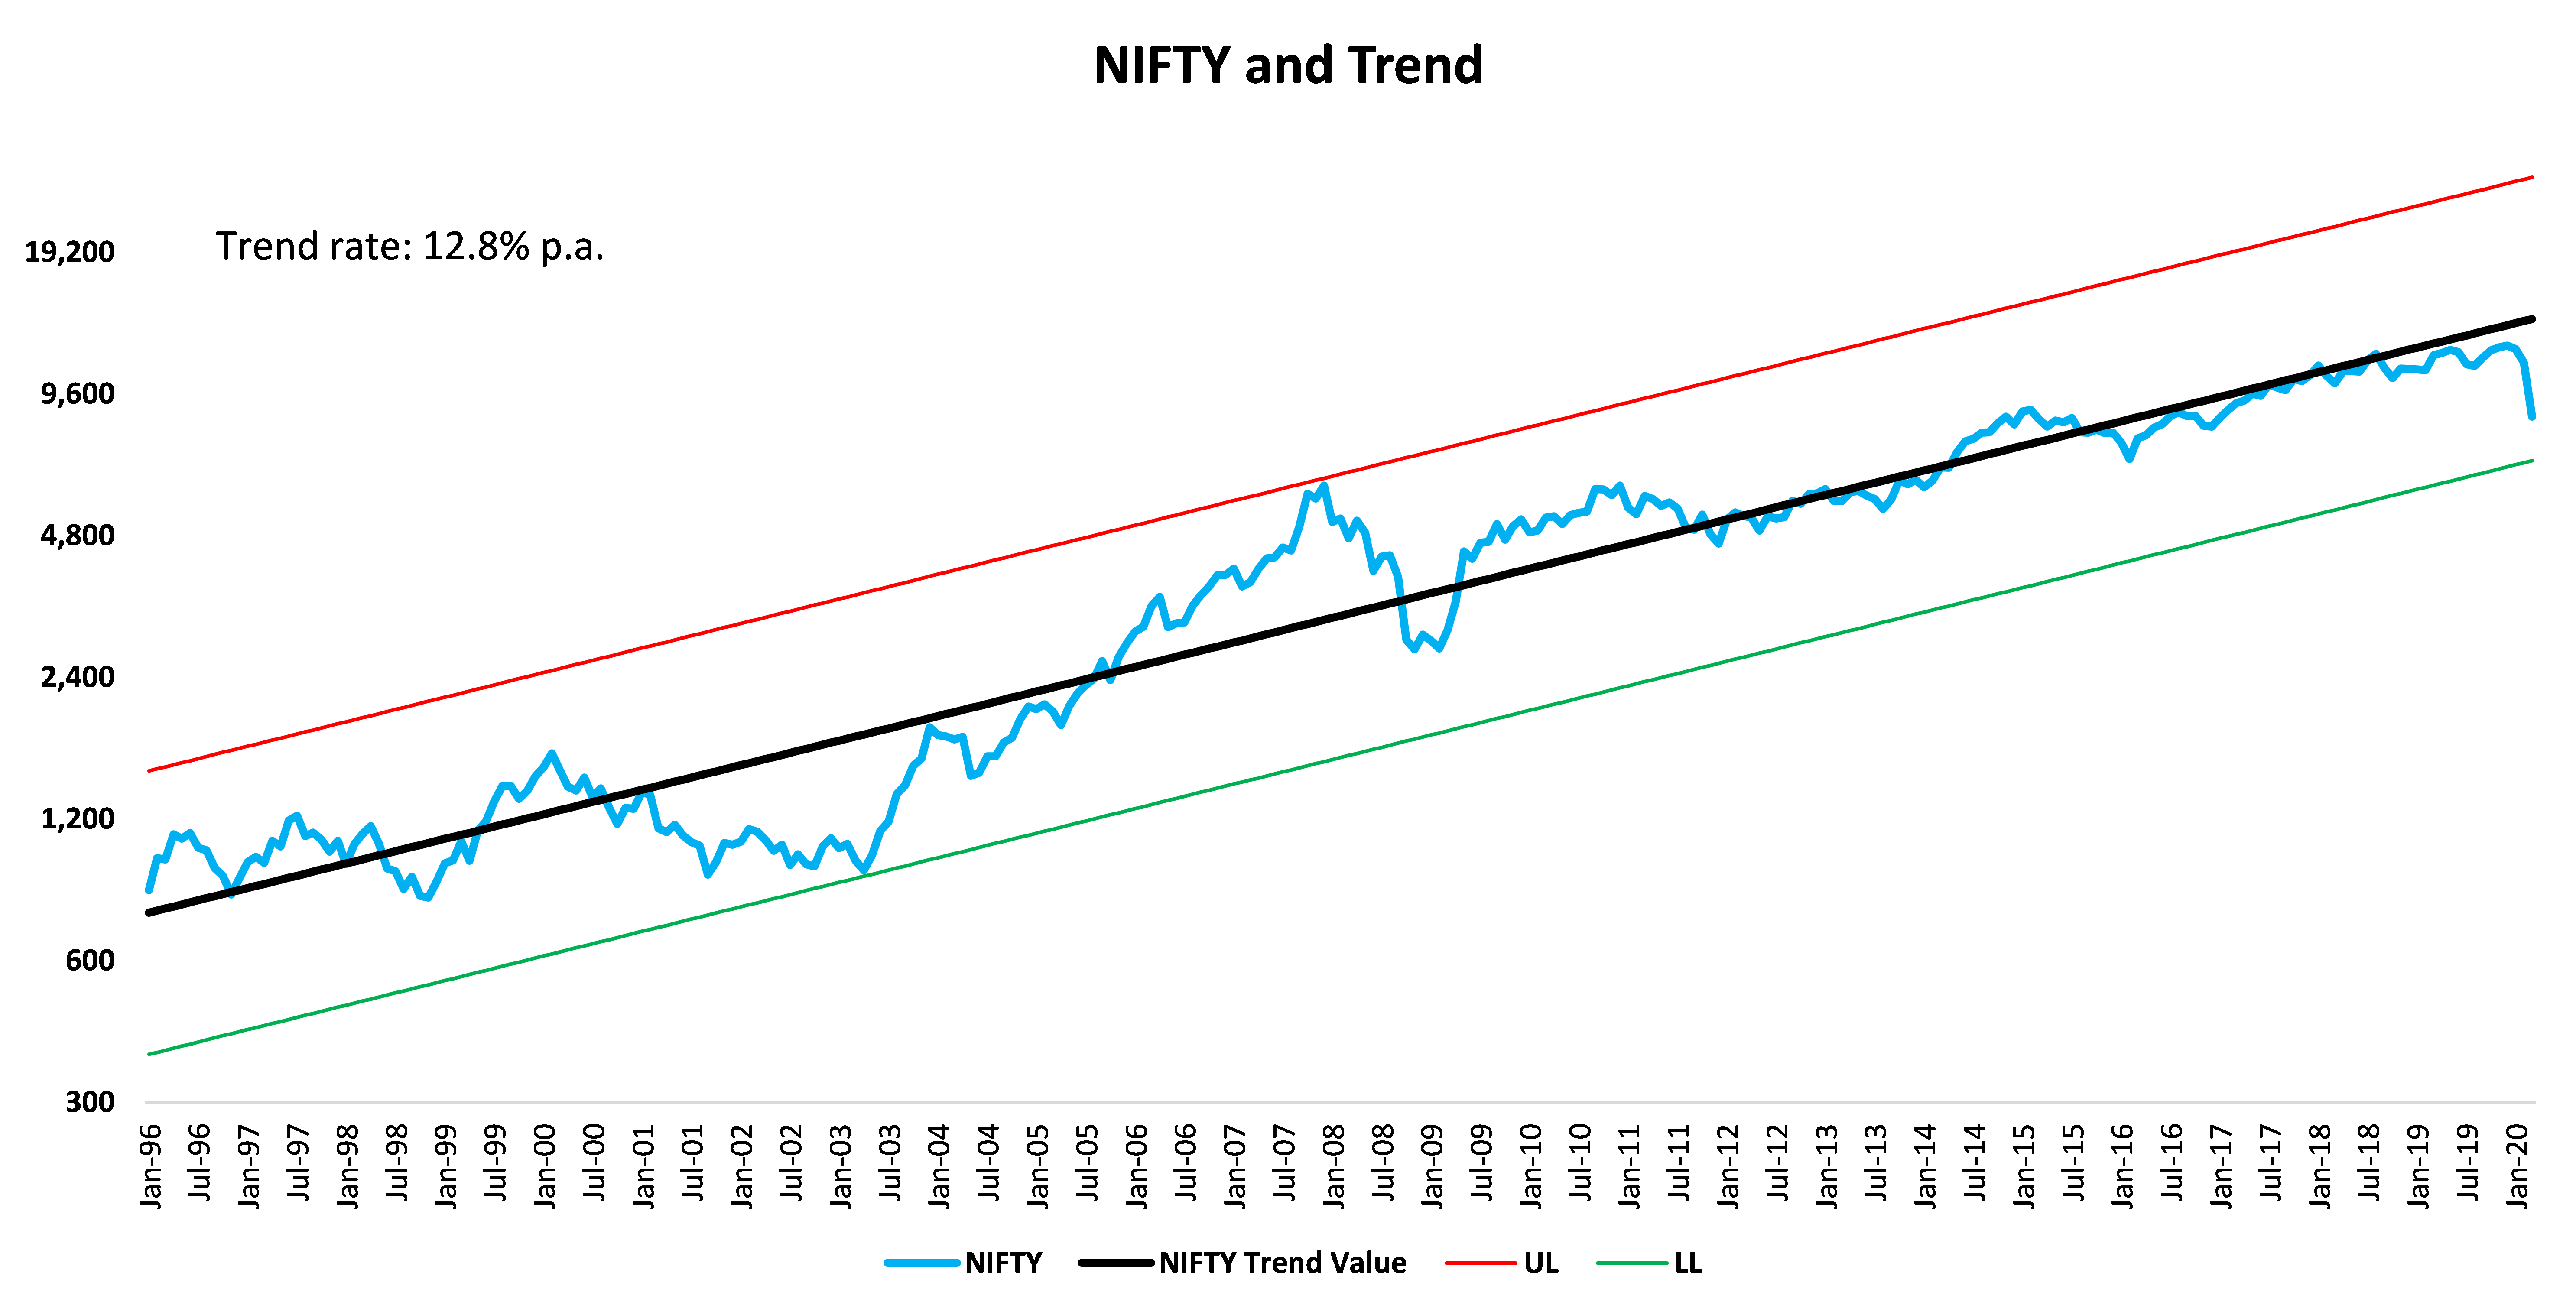
For an alternative picture, let’s take a look at the NIFTY 50 index; an index that started much later. Table 3 shows the returns of the NIFTY 50 index for the first two decades of its existence, the last four years in the ongoing third decade, and the full period. As against the widely touted Sensex’s numbers, NIFTY’s returns since inception paint a somewhat different picture with a full period return of 9.4% per annum and the annualized trend rate of 12.8%. In that same period, the Sensex also sports a very similar performance.
Table 3: NIFTY 50 Index – Returns Since Inception
Source: Investing.com[8], MAEG’s calculations
What we see above is that as against the high double digit numbers usually talked about, the NIFTY has compounded at a rate of 9.4%; a difference of about five percentage points when compared to the Sensex’s return from 1979 onwards. Much as Figure 1 earlier, Figure 2 shows the NIFTY along with its trend values over time.
Figure 2: Nifty 50 index, Trend Values, and Upper and Lower Limits
Source: Investing.com[9], MAEG’s calculations
Economic liberalization – Why is it important for Indian stock market returns
As we discussed in one of our earlier articles (here), “Pre-liberalization, businesses that existed were likely earning returns well above cost of capital, as there were significant barriers to entry driven by government policies and the license-raj system . However, as the economy started to open, it would have been logical to expect returns on capital to be driven lower since competition, both from local as well as international players, was about to increase.”
The key point to understand is that before liberalization, businesses existed in a controlled environment. In the post-liberalization period, competition increased driving down the underlying returns on capital of businesses operating in the economy.
Summary
While the Dalal Street is quick to use 1979 as the starting point when talking about Indian equity returns, the year 1992 serves as a key point of break in returns on capital. Note that the returns that investors enjoy from equities can be approximated as a function of i) the initial valuation, ii) the underlying return of the business, and iii) the terminal/exit valuation. Over extended periods of time, contribution of change in valuation levels is rather muted. It is the underlying returns on capital that decide the return on equities.
As the liberalization drove returns on capital of businesses lower, it also resulted in lower ongoing returns from equities. Accordingly, we contend that it is the 1992 onwards return that is the right proxy for ongoing Indian equity market returns. As seen, the trend return from Indian equities post 1991 is 11.3% annualized. We suggest that the next time your advisor starts with 1979 as the reference point for equity returns, refer them to this article and ask them for 1992 onwards returns.
At Insider Monkey we leave no stone unturned when looking for the next great investment idea. For example, we believe electric vehicles and energy storage are set to become giant markets, and we want to take advantage of the declining lithium prices amid the COVID-19 pandemic. So we are checking out investment opportunities like this one. We read hedge fund investor letters and listen to stock pitches at hedge fund conferences. Our best call in 2020 was shorting the market when S&P 500 was trading at 3150 after realizing the coronavirus pandemic’s significance before most investors. You can subscribe to our free enewsletter below to receive our stories in your inbox:
Through this series of articles, we will make an effort to dispel some common investing myths and misconceptions. Many of these have significant adverse impact on the financial outcomes of your portfolio. However, they do serve to benefit the cheque books of some of certain intermediaries whose livelihood depends on you staying rooted in these myths.
Our sincere hope is that this series of notes will help to dispel some of these myths. The next time your financial advisor tries to impart confidence to you, please hold on to your money tightly.
Disclosure: None
Footnotes
[1] Sneaky Pete, Season 2, Episode 9
[2] All returns in this article are calculated in Indian rupee terms. Further, we have not included the impact of dividends in our analysis.
[3] https://www.bseindia.com/Indices/IndexArchiveData.html
[4] The S&P BSE Sensex was launched on January 2nd, 1986. Source: https://www.bseindia.com/static/about/History_Milestones.html
[5] The Securities and Exchange Board of India was established on April 12, 1992 in accordance with the provisions of the Securities and Exchange Board of India Act, 1992. Source: https://www.sebi.gov.in/about-sebi.html
[6] https://www.bseindia.com/Indices/IndexArchiveData.html
[7] https://www.bseindia.com/Indices/IndexArchiveData.html
[8] https://www.investing.com/indices/s-p-cnx-nifty-historical-data
[9] https://www.investing.com/indices/s-p-cnx-nifty-historical-data


