Value investing has always traditionally relied on an analysis of company fundamentals, however, adding news sentiment into the mix can potentially improve timing and increase returns.
Below we provide current short sell candidates using a value-sentiment screener developed using RavenPack news analytics data.
The model has evidenced positive results since we began screening for eligible stocks in the summer of 2019, delivering an overall 125% return over the period and a 56% hit rate.

Q3 2020 hedge fund letters, conferences and more
News Sentiment and Value Investing
Studies show news sentiment data – aggregated from millions of financial news articles online – can help investors to improve stock market timing.
Mispriced stocks can remain under or overpriced for long periods of time, and buying and selling too early can tie up valuable capital in non-profit making investments.
Sentiment data can get around this problem by signalling the optimum time to make the trade, which is just before the stock price undergoes a major reversal and realigns with its fair value.
In the case of underpriced stocks this is when medium-term sentiment turns higher and vice versa for overpriced stocks. Research has found that turns in sentiment often foreshadow major moves, and trading the signals can prove lucrative.
At the time of writing, with stocks making new highs with each passing week, it seems more likely that the majority are now at risk of being overpriced, and some may be ripe to fall.
We put the theory to the test earlier in the year and built a stock screener that looks for both stocks that are overpriced and exhibiting negative news sentiment.
Our model is inspired by research carried out by Empirical Research Partners (ERP) using RavenPack news sentiment data. Whilst ERP has not divulged the exact specifications they used for screening for stocks that are overpriced most value investors look for the same basic characteristics when trying to identify overpriced stocks. Our version combines three key metrics – a high P/E ratio (>50), high debt relative to the sector (>50% of companies), and low expected future earnings (PEG ratio of >1).
For sentiment we use a slightly screen from ERP who looked at the bottom 4 deciles, opting instead to sample the bottom 20% of stocks by 30-day average sentiment, a smoothing we have found particularly useful in previous studies.
According to ERP overvalued stocks that fit their criteria for being overpriced but suffering from low sentiment have fallen on average at least 10% over the next 12-months, although as already discussed the two models do differ slightly.
Current Shortlist
Our model found a total of four short-sell candidates that met both the overvaluation criteria and exhibited low news sentiment. Screens were conducted at weekly intervals from between late October and December 22 2020.
Vornado Realty Trust (VNO)
Price at Screen/Now: $36.03/$36.22
P/E Ratio: 133.44
Debt/Equity: 1.45
PEG: 4.42
Vornado (VNO) invests in office space and high street retail outlets in Manhattan. No clues for guessing why this makes the list – the Coronavirus pandemic has hit business hard, especially shops, and has kick-started an existing trend towards home-working that is likely to impact on office rentals. The future looks to be for a rise in online shopping which is likely to squeeze traditional high street retail increasing the risk for Vornado’s portfolio. The date of the selection was November 12.
Americold Realty Trust (COLD)
Price at Screen/Now: $33.60/$35.40
P/E Ratio: 85.62
Debt/Equity: 1.19
PEG: 3.85
Americold (COLD) provides comprehensive supply chain solutions and owns warehousing and temperature storage facilities across the U.S. Americold’s financials are relatively solid – it’s third-quarter earnings were actually up on the previous year. P/E ratio is high at 85.62 but not as high as some. The Debt/Equity ratio is higher than the industry average. Of the selections, it looks to be the least vulnerable to the downturn, online trends, and market conditions. Nevertheless, the stock meets our criteria. It screened on December 9.
Camden Property Trust (CPT)
Price at Screen/Now: $98.39/$95.40
P/E Ratio: 52.42
Debt/Equity: 1.05
PEG: 4.66
Camden Property Trust (CPT) is in the S&P 400 and is one of the largest publicly-traded companies in the U.S. It is engaged in the ownership, management, development, redevelopment, acquisition, and construction of multifamily apartment units. The economic downturn due to Covid has hit the company’s financials leading to a -1.8% loss in operating income compared to Q3 ’19. The subdued rental market is also likely to impact Camden’s profitability, at least over the medium-term. The company screened on December 9.
Acadia Realty Trust (AKR)
Price at Screen/Now: $14.91/$13.80
P/E Ratio: 54.16
Debt/Equity: 1.07
PEG: 12.18
Acadia (AKR) has appeared on our radar before and has been flashing overbought on and off for over a year. The company focuses on the ownership, acquisition, development, and management of retail properties located in the United States. The company financials show a -$66 million loss in the first three quarters of 2020. Similar to Vornado it looks vulnerable to changing work and shopping trends. The fallout from Covid is likely to subdue the rental market for some time too as well as push up tenant foreclosure. It appeared on our screener in the summer of 2019 and fell 14.0% over the subsequent 12-month period. It has also appeared on our winter 2019 screen below. It was again selected by our model on December 16.
Review From 12-Months Ago
The ERP model forecasts an average 10% return over the next 12-month period for stocks that meet the criteria and it would be interesting and instructive to see how well our adapted model performed at selecting short-sell candidates 12 months ago. Did it pick stocks that went on to fall the 10% average suggested by the research?
Screening for stocks a year ago gives us three short-sell candidates, listed in the table below, along with how far their share-price fell over the subsequent 12-month period.
The results show that out of the three stocks picked up by the screener between late October and December 2019 two declined over the subsequent 12-month period as forecast by the model.
Aggregate declines amounted to -83.68% and gains to +39.94% giving a difference of -43.74% – the profit.
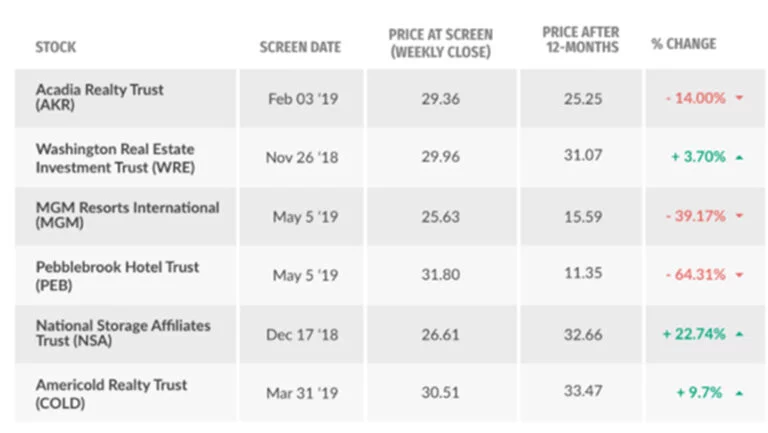
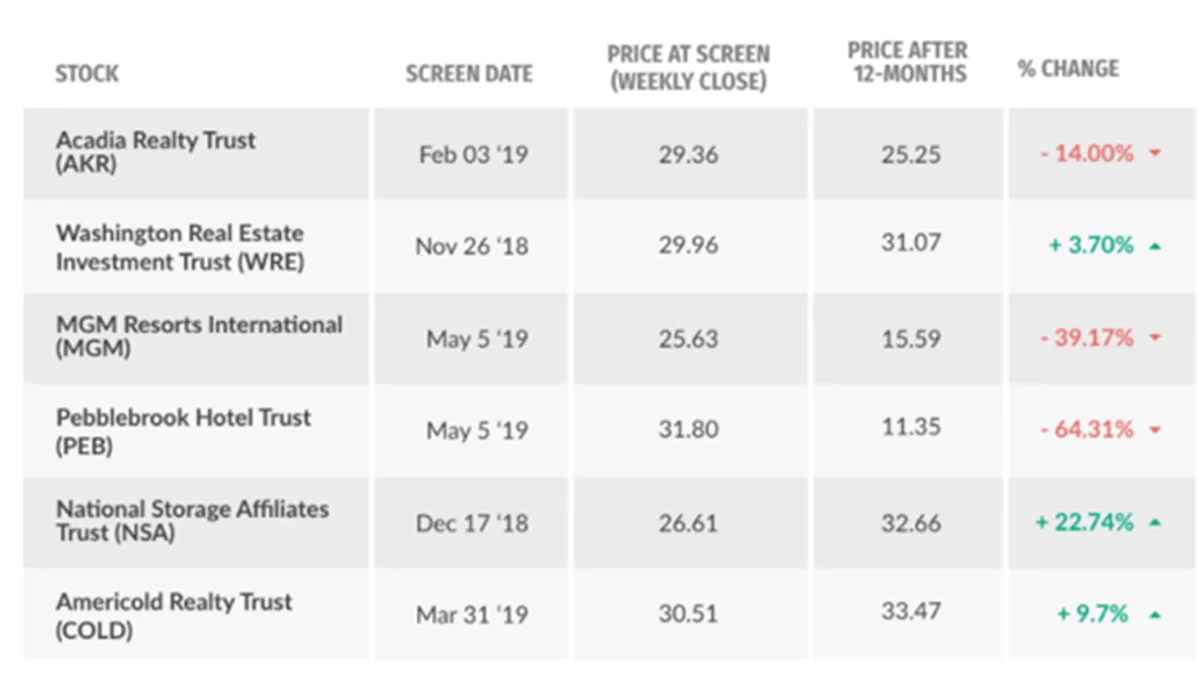
If we add this to the results to a backtest we conducted using the same model 6-months earlier in the summer (see table below) we can see that the model as a whole has delivered 201.16% of gains versus 76.08% of losses, with a profit of 125.08%.
Suggested Articles:
- 25 Biggest Questions in Science
- 15 Best Dividend Stocks With Upside Potential.
- Billionaire Lee Ainslie’s Top 10 Stock Picks
- 25 Largest Lakes in the US
Disclosure: None.


