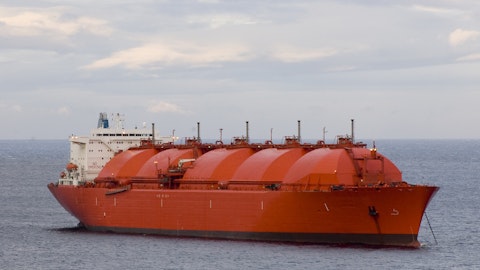
The balance sheet remains pretty much the same. We have the scheduled depreciation of our vessels and then $411 million of cash on the asset side. So we keep it very simple and that results in a book equity of $848 million of book equity ratio of 31%. And then as a reminder, these book values reflect that these vessels were ordered at a low point in the cycle and therefore, does not reflect the market value today. On the funding side, our debt portfolio, we did a complete refinancing of our fleet with the balance sheet optimization program, that was concluded in the first quarter this year or last year. And that gives us a flexible blending of both long-term leases up to 12 years for some of them. And then the traditional bank portfolio, where we have structured $400 million of our debt as a non-amortizing up to 6 years our revolving credit facility.
And when we have $410 million, $411 million of cash available that gives us a flexible tool for cash management, so we can repay the RCFs in between quarters. And then we reduced the interest rate cost and we pay 70 basis points in commitment fee. If we look at the debt maturity profile, our first maturity is in 2028 and that’s related to our bank financing. So we have a lot of headroom ahead of us and this is a very supportive financing position to be in the support of the business and our business case. We have, over the last three years, been quite active in the interest rate market. We entered into the market in with a lot of additions with long-term interest rate swap in 2021. As the interest rates have increased and we have also added more but also amended the duration profile to make use of the gains and reduce the tail end risk of this portfolio.
So today, we have a hedging of our interest to traditional interest rate swaps but also off-balance sheet items like fixed rate leases. For this year, we have an average net hedging ratio of about 65%. And then it tails off more or less equal, as you will see in the forward curve of the sofa rates going forward. We are monitoring the interest rate market pretty closely and we are looking into when to add more exposure on the tail and to increase our hedge ratio from ’25 and onwards. And that concludes the financial sector and back to you, Øystein.
Øystein Kalleklev: Okay. Thank you, Knut. So in terms of the interest rate hedging, where Jay Powell, he was on 60 minutes on Sunday and talked about the interest rate market and it seems like March will be a bit premature for cut but May is very likely and it doesn’t rule out bigger cuts down the road. So I think we have a profile of the hedging which is very much in line with a pivot from Fed within this year which we have expected and position ourselves for as inflation is starting at least to subdue a bit. In terms of the LNG market, we had another eventful year. It seems to be the case every year, ’22 was all about curtailment of Russian pipeline gas to Europe prior to the innovation and are subsequent to the innovation when we had the blow-up of the gas lines.
So this year has been a bit more calm, I would say. We have seen LNG prices migrating down to more normal levels. We did have a peak in spot LNG price last August of August 2022 of per $100 per million BTU equating to around $600 per barrel of oil. We are now down to more normal levels, $8, $9 now which means that LNG is cheap again. And when things are cheap, people tend to consume more of it. So we are now at a big discount to oil. More importantly also, we are at a huge discount to especially diesel. So this means that it’s firing up demand in new regions. And actually in longer term, it’s better to have a more sound price of the product. Otherwise, we will have demand destruction. In terms of the exporters and importers, we have a swap of the thrones.
We have China coming back, being the biggest LNG importer again after they became the biggest in ’21. They implemented Zero-COVID policies which resulted in China reducing its LNG import in ’22 of 20%. They are bouncing back in ’23 and retaking the throne as the biggest importer for the second time. Japan has traditionally been the biggest. But Japan is firing up the Nukes and also the coal power plants, they built, I believe, 40 of those since Tokushima; so we do see that Japan demand has been on the soft side. But as I will come back to, there are margination countries which is snapping up these cheaper cargoes. Last year was a year with limited new capacity being installed, although we did have a volume growth of around 3%, driven by U.S., particularly restart of Report contributed with a lot of new volumes this year.
Also [indiscernible] with fairly muted export capacity being implemented and there are some uncertainty about Arctic LNG 2. So 13 million tonnes, half of this is about Arctic LNG 2, the first train. This is operational, they are planning to commissioning it during Q1. So we’ll see how the Russians are managing to sell these cargoes, the experience from the crude markets, both oil and products seems to be the Russians are very good at finding loopholes and finding customers who are willing to buy this cargo. So this will be one of the key questions this year. But certainly, if they are moving the cargoes, they will be very mileage intensive. Fragile maritime supply chains has been a big factor. That sounds like something negative. For shipping, it doesn’t — isn’t necessarily a negative.
We thrive on efficiencies, inefficiencies means typically higher ton mileage and also maybe higher ton time. So it means you need more ships in order to shift cargoes. So we had a drought in Panama. We still have the drought in Panama, the water levels in Gatun Lake [ph]. The main freshwater supply for the canal. This is our water escalator which needs to be refilled with water all the time. The water levels are still at low level. There are still restrictions in the number of transits and this will stay in place until at least the summer when we will see whether there is a sufficient rain season in Panama to replenish those water resources. From end of the year, we had similar issues with the Suez Canal there. It’s not about water, it’s about war and Houthi rebels attacking the maritime traffic.
And today, there are no LNG carriers going through the Red Sea to utilize the Suez Canal. And of course, this has some effect on ton mileage, especially for the Qatari volumes going all the way to keep of good hope to enter European customers rather than going to shortcut through Suez. So let’s look at a bit on the export and import side. As mentioned, strong growth from U.S. actually grew 27% in Q4 and up 13% for the year, flat for Australia and Qatar the two other major exporters. Russia is the fourth biggest exporter, fairly flat volume export from Russia. There’s no sanction on LNG. There are some sanctioning by the U.S. and U.K. which are not allowing Russian cargoes. But for the remaining countries, they are happy to take this cargo and especially EU who have been boosting their imports of Russian LNG.
Malaysia, fairly flat. Algeria was one of the outliers last year, growing healthy through 2023. On the import side, as I mentioned, China bouncing back 16%, still a bit below the levels we’ve seen in 2021 prior to the COVID restriction. And now with the price of LNG being competitive, we expect China to grow quite healthy also in 2024. Japan is on a bit of a decline. And South Korea, Taiwan, fairly flat. The big other driver, if you follow macroeconomics. India has been enjoying a very long boom now. And with prices coming down to these levels, we see strong growth in India. If you look at the Q4 growth factor adding 15% for the year. So we expect this to continue. And rest of world, you see very strong growth in Q4 driven, as I said, by these low prices.
Europe, fairly flat and I will cover that in more detail shortly. So just to summarize, the big movers and shakers U.S. growing steady, Algeria, as I mentioned, Qatar are flat and Egypt, where there has been issues with feeds from Israel, given the contract in the area. They have not been — we have had shutdowns of feed gas [ph] from Israel to Egypt liquefaction plans. There’s also been domestic demand for this gas. So they’ve been exporting less than in the past. However, this is not that important for the shipping market. Egypt is very close to the main import nations in Europe. So it’s a very low ton mileage on these voyages. Heading back to Europe in Europe has been the lucky man the last two seasons. European LNG imports used to be at around 80 million, 85 million tonnes once the Russian started to reduce the flow of cargoes of gas to Europe, Europe had to turn around very quickly to get access to these LNG cargoes.
And this is mostly U.S. where you have flexible LNG cargoes. And they’ve been bidding up the price. And as I mentioned, they bid the price all the way up to $100 per million BTU, making LNG unaffordable for Emerging Asia [ph]. And — but with two winters in a row with fairly mild weather, the Europe has been able to fill up its inventories. This is also driven by what I will cover on the next slide. Demand subversion or demand destruction these kind of high prices is, of course, affecting behavior and use of LNG. So gas consumption in Europe has fallen off a cliff and it’s now shortly bouncing. But you can see on the right-hand side, inventory levels in Europe are quite healthy. We have some time still to go, usually, the kind of the heating season lasts until first of April.


