
Wesco International Inc.’s analysis versus peers uses the following peer-set: W.W. Grainger, Inc. (NYSE:GWW), Avnet, Inc. (NYSE:AVT), Anixter International Inc. (NYSE:AXE), Electrocomponents plc (LON:ECM), Premier Farnell plc (LON:PFL) and Houston Wire & Cable Company (NASDAQ:HWCC). The table below shows the preliminary results along with the recent trend for revenues, net income and returns.
| Quarterly (USD million) | 2012-09-30 | 2012-06-30 | 2012-03-31 | 2011-12-31 | 2011-09-30 |
|---|---|---|---|---|---|
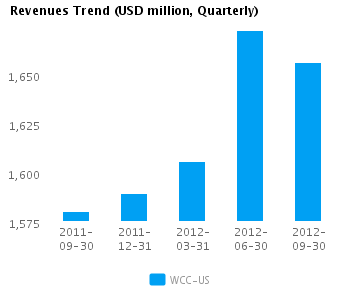
| Revenues | 1,656.2 | 1,672.7 | 1,606.0 | 1,589.5 | 1,580.4 |
| Revenue Growth % | (1.0) | 4.2 | 1.0 | 0.6 | 3.7 |
| Net Income | 63.4 | 58.9 | 53.0 | 54.8 | 53.9 |
| Net Income Growth % | 7.7 | 11.1 | (3.4) | 1.8 | 7.3 |
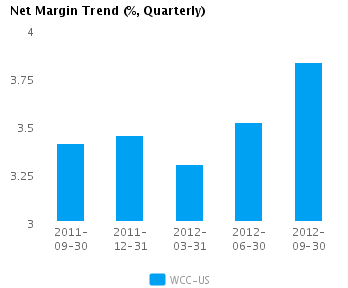
| Net Margin % | 3.8 | 3.5 | 3.3 | 3.5 | 3.4 |
| ROE % (Annualized) | 16.8 | 16.4 | 15.4 | 16.7 | 17.0 |
| ROA % (Annualized) | 7.7 | 7.4 | 6.8 | 7.1 | 7.1 |
Valuation Drivers
Wesco International Inc. trades at a lower Price/Book multiple (1.8) than its peer median (3.3). The market expects WCC-US to grow at about the same rate as its chosen peers (PE of 14.0 compared to peer median of 11.7) and to maintain the peer median return (ROE of 16.3%) it currently generates.
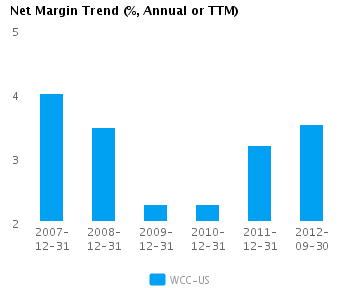
The company’s asset efficiency (asset turns of 2.0x) and net profit margins of 3.5% are both median for its peer group. WCC-US’s net margin continues to trend upward and is now similar to its five-year average net margin of 3.0%.
Economic Moat
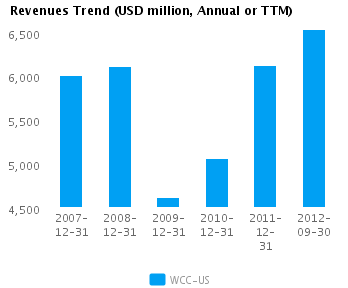
The company enjoys both better than peer median annual revenue growth of 21.0% and better than peer median earnings growth performance 69.9%. WCC-US currently converts every 1% of change in annual revenue into 3.3% of change in annual reported earnings. We view this company as a leader among its peers.
WCC-US’s current return on assets is around the same as its peer median (7.1% vs. peer median 8.5%). This recent performance contrasts with its less than peer median return on assets over the past five years (6.2% vs. peer median 9.4%) suggesting that the company’s relative operating performance is improving.
The company’s gross margin of 20.3% is around peer median suggesting that WCC-US’s operations do not benefit from any differentiating pricing advantage. In addition, WCC-US’s pre-tax margin is less than the peer median (5.0% compared to 6.9%) suggesting relatively high operating costs.
Growth & Investment Strategy
While WCC-US’s revenues growth has been below the peer median in the last few years (0.1% vs. 5.7% respectively for the past three years), the market still gives the stock an about peer median PE ratio of 14.0. The market seems to see the company as a long-term strategic bet.
WCC-US’s annualized rate of change in capital of 2.4% over the past three years is less than its peer median of 7.1%. This below median investment level has also generated a less than peer median return on capital of 7.4% averaged over the same three years. This outcome suggests that the company has invested capital relatively poorly and now may be in maintenance mode.
Earnings Quality
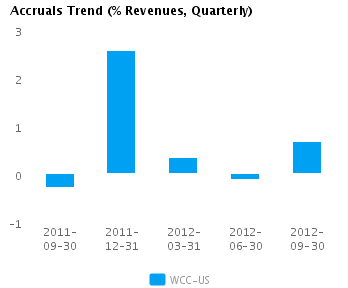
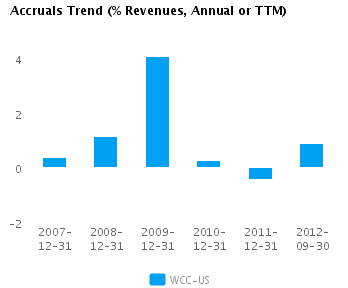
WCC-US’s net income margin for the last twelve months is around the peer median (3.5% vs. peer median of 4.3%). This average margin and relatively conservative accrual policy (0.8% vs. peer median of -0.0%) suggests possible understatement of its reported net income.
WCC-US’s accruals over the last twelve months are around zero. However, this modestly positive level is also greater than the peer median which suggests some amount of building of reserves.
Trend Charts
