Actuant Corporation (NYSE:ATU) recently reported its preliminary financial results based on which we provide a unique peer-based analysis of the company. Our analysis is based on the company’s performance over the last twelve months (unless stated otherwise). For a more detailed analysis of this company (and over 40,000 other global equities) please visitwww.capitalcube.com.
Actuant Corp. Cl A’s analysis versus peers uses the following peer-set: Parker-Hannifin Corporation (NYSE:PH), Rotork p.l.c. (LON:ROR), Crane Co. (NYSE:CR), BELIMO Holding AG (BEAN), Sun Hydraulics Corporation (NASDAQ:SNHY) and CKD Corp (TYO:6407). The table below shows the preliminary results along with the recent trend for revenues, net income and returns.

Valuation Drivers
Actuant Corp. Cl A’s current Price/Book of 2.1 is about median in its peer group. The market expects ATU-US to grow faster than the median of its chosen peers (PE of 25.8 compared to peer median of 18.6) and to improve its current ROE of 8.8% which is below its peer median of 22.4%. Thus, the market seems to expect a turnaround in ATU-US’s current performance.
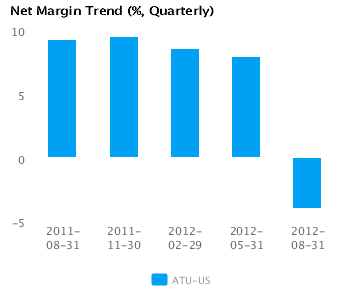
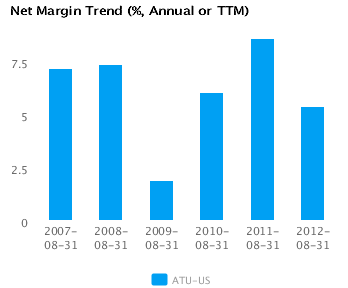
The company does not seem to have a viable operating strategy as is evident from low net profit margins (currently 5.4% vs. peer median of 8.8%) and poor asset turns (currently 0.8x compared to peer median of 1.2x). We classify this operating model as problematic relative to its peers. ATU-US’s net margin has declined 3.2 percentage points from last year’s high and is now below its five-year average net margin of 6.2.
Economic Moat
ATU-US’s revenues have changed in-line with its peers (year-on-year change in revenues is 11.1%) but its earnings have lagged (annual reported earnings have changed by -29.9% compared to the peer median of -16.0%), implying that the company has less control over its costs relative to its peers. ATU-US is currently converting every 1% of change in revenue into -2.7% change in annual reported earnings.
ATU-US’s return on assets is less than its peer median currently (4.3% vs. peer median 10.4%). It has also had less than peer median returns on assets over the past five years (4.9% vs. peer median 8.2%). This performance suggests that the company has persistent operating challenges relative to peers.
The company’s gross margin of 40.0% is around peer median suggesting that ATU-US’s operations do not benefit from any differentiating pricing advantage. In addition, ATU-US’s pre-tax margin is less than the peer median (7.5% compared to 12.0%) suggesting relatively high operating costs.
Growth & Investment Strategy
ATU-US has grown its revenues faster than its peers (9.0% vs. 4.6% respectively for the past three years). The market also sees relatively higher long-term growth prospects for the company, giving it a better than peer median PE ratio of 25.8. Overall, we classify the company’s growth prospects as superior relative to its peers.
ATU-US’sannualized rate of change in capital of 7.9% over the past three years is around its peer median of 7.9%. This investment has generated a less than peer median return on capital of 7.3% averaged over the same three years. The below median return implies that the company is not investing well.
Earnings Quality
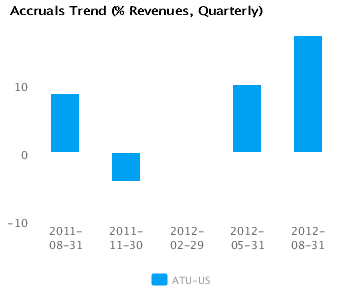
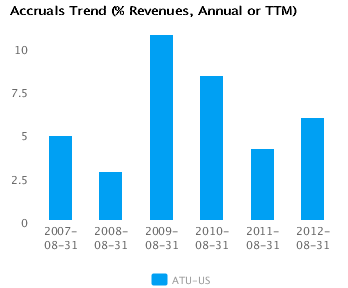
ATU-US reported relatively weak net income margins for the last twelve months (5.4% vs. peer median of 8.8%). This weak margin performance and relatively conservative accrual policy (5.9% vs. peer median of 3.3%) suggest the company might likely be understating its net income, possibly to the extent that there might even be somesandbagging of the reported net income numbers.
ATU-US’s accruals over the last twelve months are positive suggesting a buildup of reserves. In addition, the level of accrual is greater than the peer median — which suggests a relatively strong buildup in reserves compared to its peers.
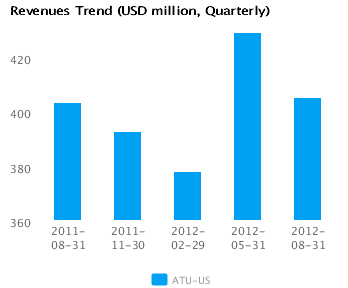
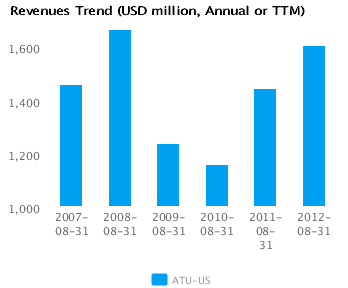
Trend Charts