Earnings Analysis: Baker Hughes Inc. (NYSE:BHI)

Earnings Analysis: Baker Hughes Inc. (NYSE:BHI)Baker Hughes Incorporated (NYSE:BHI) recently reported its preliminary financial results based on which we provide a unique peer-based analysis of the company. Our analysis is based on the company’s performance over the last twelve months (unless stated otherwise). For a more detailed analysis of this company (and over 40,000 other global equities) please visit www.capitalcube.com.

Baker Hughes Inc.’s analysis versus peers uses the following peer-set: Schlumberger Limited. (NYSE:SLB), National-Oilwell Varco, Inc. (NYSE:NOV), Halliburton Company (NYSE:HAL), Cameron International Corporation (NYSE:CAM), Weatherford International Ltd (NYSE:WFT), Subsea 7 SA (PINK:SUBCY), Oceaneering International (NYSE:OII), Oil States International, Inc. (NYSE:OIS), Seacor Holdings, Inc. (NYSE:CKH) and Exterran Holdings, Inc. (NYSE:EXH). The table below shows the preliminary results along with the recent trend for revenues, net income and returns. You can also read CapitalCube’s recent Earnings Analysis for Halliburton Co. (HAL).

Quarterly (USD million) 2012-09-30 2012-06-30 2012-03-31 2011-12-31 2011-09-30
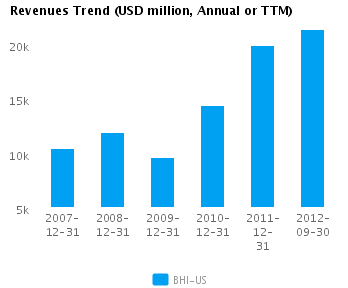
Revenues 5,228.0 5,326.0 5,355.0 5,387.0 5,178.0
Revenue Growth % (1.8) (0.5) (0.6) 4.0 9.2
Net Income 265.0 439.0 379.0 314.0 706.0
Net Income Growth % (39.6) 15.8 20.7 (55.5) 108.9
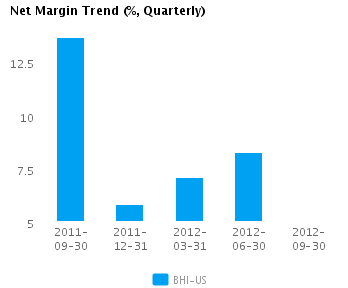
Net Margin % 5.1 8.2 7.1 5.8 13.6
ROE % (Annualized) 6.3 10.7 9.5 8.0 18.5
ROA % (Annualized) 4.0 6.8 6.0 5.1 11.8

Valuation Drivers

Baker Hughes Inc. trades at a lower Price/Book multiple (1.2) than its peer median (2.5). The market expects BHI-US to grow earnings about as fast as the median of its chosen peers (PE of 14.1 compared to peer median of 16.4) but not to expect much improvement in its below peer median rates of return (ROE of 8.6% compared to the peer median ROE of 13.0%).

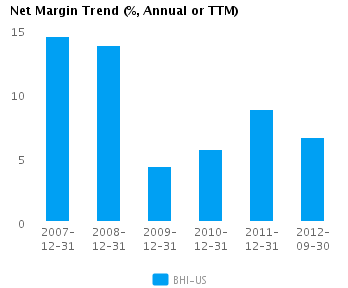
The company’s profit margins are below peer median (currently 6.6% vs. peer median of 10.2%) while its asset efficiency is about median (asset turns of 0.8x compared to peer median of 0.7x). BHI-US’s net margin is less than (but within one standard deviation of) its five-year average net margin of 9.4%.

Economic Moat

The company enjoys both better than peer median annual revenue growth of 37.6% and better than peer median earnings growth performance 114.2%. BHI-US currently converts every 1% of change in annual revenue into 3.0% of change in annual reported earnings. We view this company as a leader among its peers.

BHI-US’s return on assets is now less than its peer median (5.5% vs. peer median 8.1%) in contrast to its returns over the past five years which were around the peer median (9.4% vs. peer median 8.5%). Recent performance suggests that the company’s historical competitive advantage is slipping away.

The company’s gross margin of 27.3% is around peer median suggesting that BHI-US’s operations do not benefit from any differentiating pricing advantage. In addition, BHI-US’s pre-tax margin is less than the peer median (9.6% compared to 14.9%) suggesting relatively high operating costs.

Growth & Investment Strategy

While BHI-US’s revenues have grown faster than the peer median (18.7% vs. 9.0% respectively for the past three years), the market gives the stock an about peer median PE ratio of 14.1. This suggests that the market has some questions about the company’s long-term strategy.

BHI-US’s annualized rate of change in capital of 29.4% over the past three years is greater than the peer median of 19.0%. This relatively high investment has generated a less than peer median return on capital of 6.6% averaged over the same three years. The relatively high investment and low current returns lead us to believe that the company is betting heavily on the future.

Earnings Quality

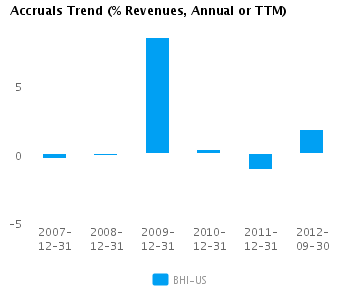
BHI-US reported relatively weak net income margins for the last twelve months (6.6% vs. peer median of 10.2%). This weak margin performance and relatively conservative accrual policy (1.8% vs. peer median of 1.2%) suggest the company might likely be understating its net income, possibly to the extent that there might even be some sandbagging of the reported net income numbers.

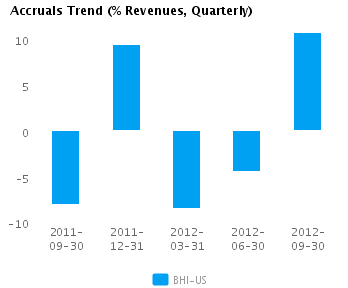
BHI-US’s accruals over the last twelve months are around zero. However, this modestly positive level is also greater than the peer median which suggests some amount of building of reserves.

Trend Charts
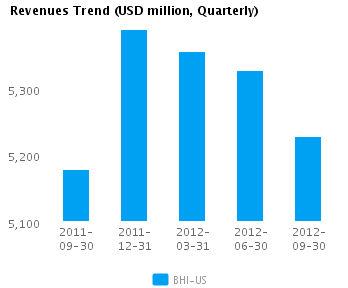
Graph of Revenues Trend for Baker Hughes Inc. (NYSE:BHI)
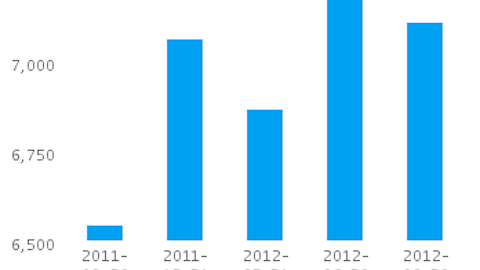
Graph of Net Margin Trend for Baker Hughes Inc. (NYSE:BHI)
Graph of Accruals Trend (% revenues, Quarterly) for Baker Hughes Inc. (NYSE:BHI)
Graph of Accruals Trend (% revenues, Annual or TTM) for Baker Hughes Inc. (NYSE:BHI)

Company Profile

Baker Hughes, Inc. is a supplier of oilfield services, products, technology and systems to the worldwide oil and natural gas industry. It also provides industrial and other products and services to the downstream refining, and process and pipeline industries. The company’s oilfield products and services are categorized under two heads: Drilling and Evaluation or Completion and Production. The Drilling and Evaluation consists of various product lines, including drill bit systems, drilling systems, wire line systems and drilling fluids. The Drilling systems includes conventional and rotary steerable systems used to drill wells directionally and horizontally, measurement-while-drilling and logging-while-drilling systems used to perform reservoir navigation services; drilling optimization services; tools for coil tubing drilling and wellbore re-entry systems; coring drilling systems; and surface logging. The Wireline systems includes tools for both open hole and cased hole well logging used to gather data to perform petrophysical and geophysical analysis; reservoir evaluation coring; casing perforation; fluid characterization; production logging; well integrity testing; pipe recovery; and seismic and microseismic services. The Drilling fluids includes emulsion and water-based drilling fluids systems; reservoir drill-in fluids and fluids environmental services. The Completion and Production consists of various product lines, including well completion systems, wellbore intervention, intelligent production systems, artificial lift, upstream chemicals and pressure pumping services product lines. The Completion systems includes products and services used to control the flow of hydrocarbons within a wellbore, including sand control systems; liner hangers; wellbore isolation; expandable tubulars; multilaterals; safety systems; packers and flow control; and tubing conveyed perforating. The Wellbore intervention includes products and services used in existing wellbores to improve their performance, including thru-tubing fishing; thru-tubing inflatables; conventional fishing; casing exit systems; production injection packers; remedial and stimulation tools; and wellbore cleanup. The Intelligent production systems includes products and services used to monitor and dynamically control the production from individual wells and fields, including production decisions services; chemical injection services; well monitoring services; intelligent well systems; and artificial lift monitoring. The Artificial lift includes electric submersible pumps systems; progressing cavity pump systems; gas lift systems; and surface horizontal pumping systems. The Upstream chemicals include chemicals and chemical application systems to provide flow assurance, integrity management and production management for upstream hydrocarbon production. The Pressure pumping services includes cementing, stimulation and coil tubing services used in the completion of new oil and natural gas wells and in remedial work on existing wells, both onshore and offshore. Baker Hughes operates through five reportable segments: North America, Latin America, Europe, Africa and Russia Caspian, Middle East and Asia Pacific and Industrial Services and Other. The North America segment comprises of Gulf of Mexico, Canada, the United States of America and Trinidad. The Latin America segment comprises of Central and South America, including Mexico. The Europe, Africa and Russia Caspian segment encompass Europe and Africa. The Middle East and Asia Pacific segment comprises of Egypt and Asia Pacific. The Industrial Services and Other segment consist of downstream chemicals, process and pipeline services, and stimulation chemicals. It also includes reservoir technology and consulting group that provides consulting services and software products, including the Gaffney, Cline and Associates reservoir consulting services. Baker Hughes was founded in April 1987 and is headquartered in Houston, TX.

Disclaimer

The information presented in this report has been obtained from sources deemed to be reliable, but AnalytixInsight does not make any representation about the accuracy, completeness, or timeliness of this information. This report was produced by AnalytixInsight for informational purposes only and nothing contained herein should be construed as an offer to buy or sell or as a solicitation of an offer to buy or sell any security or derivative instrument. This report is current only as of the date that it was published and the opinions, estimates, ratings and other information may change without notice or publication. Past performance is no guarantee of future results. Prior to making an investment or other financial decision, please consult with your financial, legal and tax advisors. AnalytixInsight shall not be liable for any party’s use of this report. AnalytixInsight is not a broker-dealer and does not buy, sell, maintain a position, or make a market in any security referred to herein. One of the principal tenets for us at AnalytixInsight is that the best person to handle your finances is you. By your use of our services or by reading any our reports, you’re agreeing that you bear responsibility for your own investment research and investment decisions. You also agree that AnalytixInsight, its directors, its employees, and its agents will not be liable for any investment decision made or action taken by you and others based on news, information, opinion, or any other material generated by us and/or published through our services. For a complete copy of our disclaimer, please visit our website www.analytixinsight.com.
This article was originally written by abha.dawesar, and posted on CapitalCube.