Earnings Analysis: Accenture PLC (ACN)

Accenture Plc (NYSE:ACN) recently reported its preliminary financial results based on which we provide a unique peer-based analysis of the company. Our analysis is based on the company’s performance over the last twelve months (unless stated otherwise). For a more detailed analysis of this company (and over 40,000 other global equities) please visit www.capitalcube.com.

Accenture PLC’s analysis versus peers uses the following peer-set: International Business Machines Corp. (NYSE:IBM), SAP AG (NYSE:SAP), Infosys Ltd (NASDAQ:INFY), Wipro Limited (NYSE:WIT), Cognizant Technology Solutions Corp (NASDAQ:CTSH), Cap Gemini SA (EPA:CAP) and Computer Sciences Corporation (NYSE:CSC).  The table below shows the preliminary results along with the recent trend for revenues, net income and returns.

Earnings Analysis: Accenture PLC (ACN)

Valuation Drivers

Accenture PLC’s current Price/Book of 11.5 is about median in its peer group. ACN-US’s operating performance is higher than the median of its chosen peers (ROE of 63.6% compared to the peer median ROE of 26.3%) but the market does not seem to expect higher growth relative to peers (PE of 18.2 compared to peer median of 17.7) but simply to maintain its relatively high rates of return.

The company’s net profit margins have been relatively poor (currently 8.6% vs. peer median of 14.5%) while its asset efficiency is better than the median (asset turns of 1.8x compared to peer median of 1.0x). This suggests a volume driven operating model relative to its peers. ACN-US’s net margin is its highest relative to the last five years and compares to a low of 5.8% in 2007.

Economic Moat

The company’s top line performance is not as good as its peers (year-on-year change in revenue is 8.9%) but its earnings performance (12.1% change year-on-year) has been similar to the peer median. Unless the company maintains or improves this relative earnings growth, it is in danger of lagging its peers. ACN-US currently converts every 1% of change in revenue into 1.4% of change in annual reported earnings.

ACN-US’s return on assets currently is around peer median (15.8% vs. peer median 15.0%) — similar to its returns over the past five years (14.7% vs. peer median 14.8%). This performance suggests that the company has no specific competitive advantages relative to its peers.

The company’s gross margin of 32.2% is around peer median suggesting that ACN-US’s operations do not benefit from any differentiating pricing advantage. In addition, ACN-US’s pre-tax margin is less than the peer median (13.1% compared to 18.7%) suggesting relatively high operating costs.

Growth & Investment Strategy

While ACN-US’s revenues have grown faster than the peer median (8.7% vs. 7.1% respectively for the past three years), the market gives the stock an about peer median PE ratio of 18.2. This suggests that the market has some questions about the company’s long-term strategy.

ACN-US’s annualized rate of change in capital of 12.8% over the past three years is around the same as its peer median of 15.6%. This investment has generated a better than peer median return on capital of 64.5% averaged over the same three years. The greater than peer median rate of return suggest that the company may be under investing in growth.

Earnings Quality

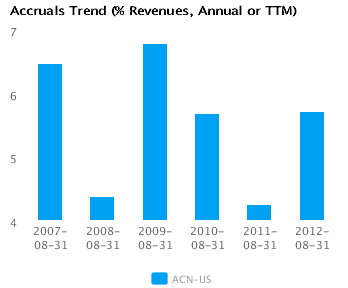
ACN-US reported relatively weak net income margins for the last twelve months (8.6% vs. peer median of 14.5%). This weak margin performance and relatively conservative accrual policy (5.7% vs. peer median of 1.8%) suggest the company might likely be understating its net income, possibly to the extent that there might even be some sandbagging of the reported net income numbers.

ACN-US’s accruals over the last twelve months are positive suggesting a buildup of reserves. In addition, the level of accrual is greater than the peer median — which suggests a relatively strong buildup in reserves compared to its peers.

Trend Charts

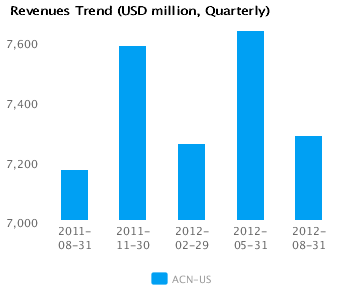
Graph of Revenues Trend for Accenture Plc (ACN)
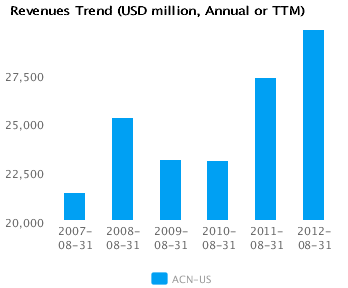
Graph of Net Margin Trend for Accenture Plc (ACN)
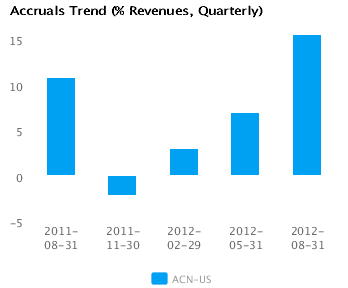
Graph of Accruals Trend (% revenues, Quarterly) for Accenture Plc (ACN)
Graph of Accruals Trend (% revenues, Annual or TTM) for Accenture Plc (ACN)

Company Profile

Accenture Plc operates as an investment holding company with interest in providing management consulting, technology and outsourcing services. The company’s business is structured around five operating groups, which together comprise nineteen industry groups serving clients in major industries around the world, namely, Communications and High Tech, Financial Services, Health and Public Service, Products and Resources. The Communications and High Tech operating group provides management consulting, technology, systems integration and outsourcing services and solutions to the communications, electronics, high technology, media and entertainment industries. The Communications industry group offers a comprehensive solutions portfolio designed to address major business and operational issues related to sales and service channels, new product innovation, network functions, corporate functions and information technology. The Electronics and High Tech industry group serves the communications technology, consumer technology, enterprise technology, semiconductor, software and aerospace/defense segments. The Media and Entertainment industry group serves the broadcast, entertainment, print, publishing and portal industries. The Financial Services operating group focuses on the opportunities created by clients’ needs to adapt to changing market conditions, including increased cost pressures, industry consolidation, regulatory changes, the creation of common industry standards and protocols, and the move to a more integrated industry model. The Banking industry group works with retail and commercial banks and diversified financial enterprises. The Capital Markets industry group helps investment banks, broker/dealers, asset-management firms, depositories, exchanges and clearing and settlement organizations transform their businesses to increase competitiveness. The Insurance industry group helps property and casualty insurers, life insurers, reinsurance firms and insurance brokers improve business processes, modernize their technologies and improve the quality and consistency of risk selection decisions. The Health and Public Service operating group operates industry groups of health and public service. The Health industry group works with healthcare providers, government health departments, policy-making authorities or regulators, managed care organizations, health insurers and other industry-related organizations to improve the quality, accessibility and affordability of healthcare and it provides services designed to help public-service entities around the world increase the efficiency of their operations, improve service delivery to citizens, and reduce their overall costs to address significant budget deficits. The Public Service industry group helps governments position themselves for the future by transforming the way they deliver public services and engage with citizens. It provides services designed to help them increase the efficiency of their operations, improve service delivery to citizens and reduce their overall costs. Accenture primarily works with defense, revenue, human services, public health, postal, justice and public-safety authorities or agencies, and its clients are generally national, state or local-level government organizations, as well as pan-geographic organizations. The Products operating group operates industry groups of automotive, industrial equipment, life sciences, retail, air, freight and travel, consumer goods and services, infrastructure and transportation services. The Air, Freight and Travel Services industry group serves airlines, freight and logistics companies across all modes of transport, and travel services companies, including hotels, tour operators, rental car companies and cruise operators. The Automotive industry group works with auto manufacturers, dealers, retailers and service providers. It helps clients develop and implement solutions focused on product development and commercialization, customer service and retention, channel strategy and management, branding, buyer-driven business models, cost reduction, customer relationship management and integrated supplier partnerships. The Consumer Goods and Services industry group serves food and beverage, alcoholic beverages, household goods and personal care, tobacco and fashion/apparel manufacturers and agribusiness and consumer health companies around the world. The Industrial Equipment industry group serves the industrial and electrical equipment, automotive supplier, consumer durable and heavy equipment industries. The Infrastructure and Transportation Services industry group serves companies in the construction, infrastructure-management and mass-transportation industries. The Life Sciences industry group works with pharmaceutical, biotechnology, medical products and other companies across the life-sciences value chain by providing services such as large-scale business and technology transformation, targeted business performance improvement, and post-merger integration. The Retail industry group serves a wide spectrum of retailers and distributors, including supermarkets, department stores, specialty premium retailers and large mass-merchandise discounters. The Resources operating group serves the chemicals, energy, forest products, metals and mining, utilities and related industries. The Chemicals industry group works with a wide cross-section of industry segments, including petrochemicals, specialty chemicals, polymers and plastics, gases and agricultural chemical companies. The Energy industry group serves a wide range of companies in the oil and gas industry, including upstream, downstream, oil services and clean-energy companies. The Natural Resources industry group serves the metals, mining, forest products and building materials industries. The Utilities industry group works with electric, gas and water utilities around the world to respond to an evolving and highly competitive marketplace. The company was founded in 1989 and is headquartered in Dublin, Ireland

Disclaimer

The information presented in this report has been obtained from sources deemed to be reliable, but AnalytixInsight does not make any representation about the accuracy, completeness, or timeliness of this information. This report was produced by AnalytixInsight for informational purposes only and nothing contained herein should be construed as an offer to buy or sell or as a solicitation of an offer to buy or sell any security or derivative instrument. This report is current only as of the date that it was published and the opinions, estimates, ratings and other information may change without notice or publication. Past performance is no guarantee of future results. Prior to making an investment or other financial decision, please consult with your financial, legal and tax advisors. AnalytixInsight shall not be liable for any party’s use of this report. AnalytixInsight is not a broker-dealer and does not buy, sell, maintain a position, or make a market in any security referred to herein. One of the principal tenets for us at AnalytixInsight is that the best person to handle your finances is you. By your use of our services or by reading any our reports, you’re agreeing that you bear responsibility for your own investment research and investment decisions. You also agree that AnalytixInsight, its directors, its employees, and its agents will not be liable for any investment decision made or action taken by you and others based on news, information, opinion, or any other material generated by us and/or published through our services. For a complete copy of our disclaimer, please visit our website www.analytixinsight.com.
This article was originally written by abha.dawesar, and posted on CapitalCube.