Last month I started a new monthly article series in which I’ll be monitoring the health of DivGro, my portfolio of dividend growth stocks. These pulse articles will be strategy focused. I’ll provide updated fair value estimates and compare those estimates to current market prices. I’ll also provide various charts to visualize recent performance. My goal is to help inform investment decisions.
In contrast, my monthly review articles present a summary of the past month’s activities along with a snapshot of DivGro’s current state, including metrics such as projected annual dividend income (PADI), average yield on cost (YoC), percentage payback and projected annual yield.
Discounted Stocks
Stocks in my portfolio that trade at a discount to fair value are candidates for further investment. Before I buy more shares, though, I’d want to analyze the stock to see if I still like the fundamentals. Conversely, if a stock is trading at a premium to fair value, I’d want to avoid buying more shares. Doing so would increase the average cost basis and reduce the average YoC.
The following chart shows the percentage discount to fair value of all the stocks in my portfolio. Green bars represent discounts, and red bars represent premiums (or negative discounts):
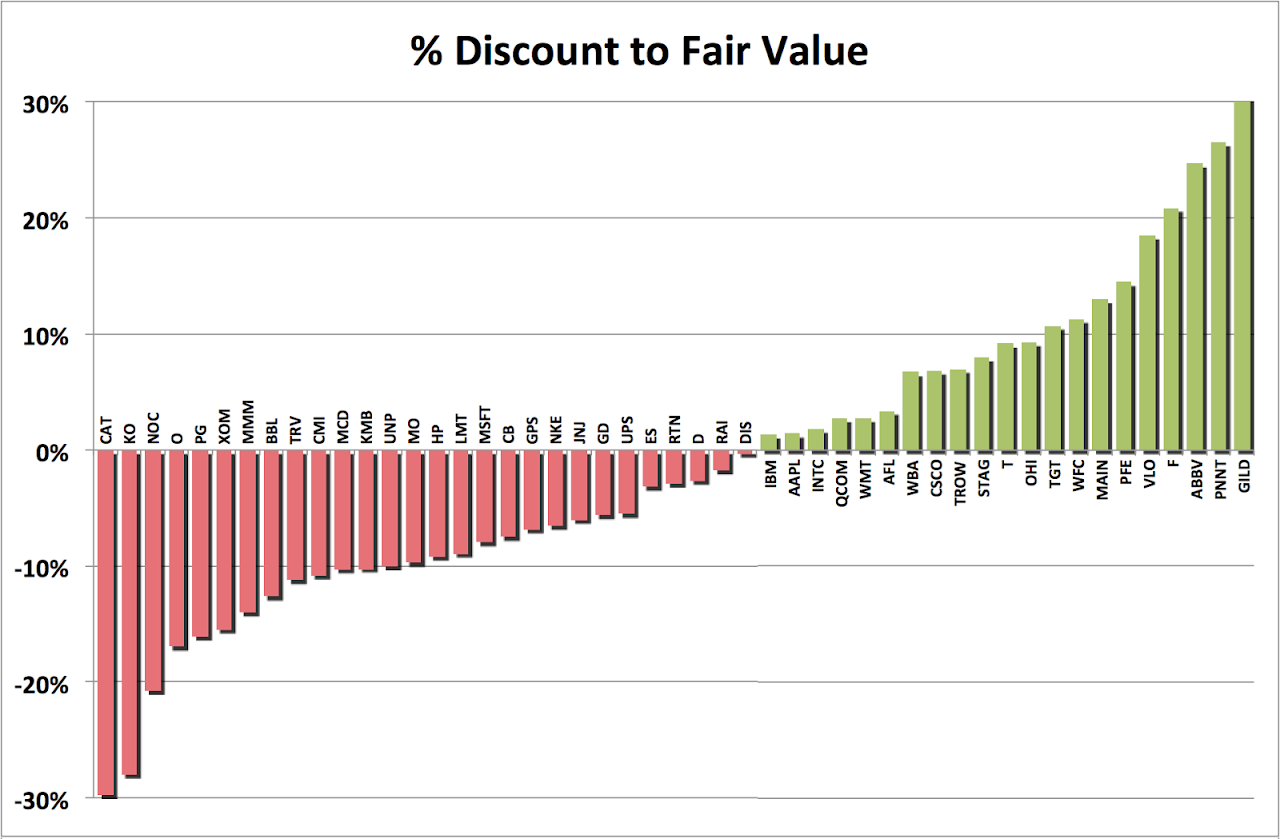 |
I like to buy stocks trading at discounts of 10% or better. According to the chart above, nine stocks are trading more than 10% below fair value. But are these stocks suitable for further investment?
As a first past test, I rank the stocks based on fundamentals and assign a 7-star rating to each stock. Stocks that earn at least five stars are suitable for further analysis:
| Gilead Sciences, Inc (GILD) | • discount 32% | • ★★★★★☆☆ |
| PennantPark Investment (PNNT) | • discount 27% | • ★☆☆☆☆☆☆ |
| AbbVie Inc (ABBV) | • discount 27% | • ★★★★★★☆ |
| Ford Motor Company (F) | • discount 21% | • ★★★★★★☆ |
| Valero Energy Corporation (VLO) | • discount 19% | • ★★★★★★☆ |
| Pfizer Inc (PFE) | • discount 14% | • ★★★☆☆☆☆ |
| Main Street Capital (MAIN) | • discount 13% | • ★★★★☆☆☆ |
| Wells Fargo & Company (WFC) | • discount 11% | • ★★★★★☆☆ |
| Target Corporation (TGT) | • discount 11% | • ★★★★★★☆ |
Of these discounted stocks, I’ve invested less than 1% of available capital in TGT and WFC. For comparison, the average position size in DivGro is 1.64%.
I have an open short put option on TGT. If shares trade below $65 on or before 20 January 2017, the chances are that I’ll get to buy 100 shares at a cost basis of less than $62 per share (when accounting for the option premium).
As for WFC, I’m not convinced that I want to increase my position after the revelation that bank employees committed fraud as part of an incentive scheme. In fact, it looks like the fallout (1) will impact business negatively for a long time to come.
The other 6-star stocks look quite attractive. I already own 600 shares of F, and I’m already leveraging that position through covered calls. I could execute the same strategy for ABBV, as I own 100 shares. Another possibility would be to sell a put option at a suitable strike price. Doing so would allow me to collect an option premium and perhaps increase my position in ABBV at a favorable entry price.
Finally, increasing my position in VLO at the current market price would lower my cost basis and simultaneously raise YoC. VLO yields 4.3%.
Quality Stocks
As I mentioned last time, sometimes it is appropriate to add shares to an existing position even if the stock is trading at fair value or a small premium. This is certainly true for great dividend growth stocks.
Here are the ten highest ranked stocks in DivGro for October. Only one stock earned 7-stars this month. The rest are all 6-star stocks:
| T. Rowe Price Group, Inc (TROW) | • discount 7% | • ★★★★★★★ |
| General Dynamics Corporation (GD) | • premium 6% | • ★★★★★★☆ |
| Valero Energy Corporation (VLO) | • discount 19% | • ★★★★★★☆ |
| 3M Company (MMM) | • premium 14% | • ★★★★★★☆ |
| Nike Inc (NKE) | • premium 7% | • ★★★★★★☆ |
| Target Corporation (TGT) | • discount 11% | • ★★★★★★☆ |
| AbbVie Inc (ABBV) | • discount 25% | • ★★★★★★☆ |
| Cisco Systems, Inc (CSCO) | • discount 7% | • ★★★★★★☆ |
| Qualcomm Inc (QCOM) | • premium 3% | • ★★★★★★☆ |
| Johnson & Johnso (JNJ) | • premium 6% | • ★★★★★★☆ |
The premium on MMM shares is too high for my taste. Of the remaining stocks, I’ve invested less than 1% of available capital in GD, NKE, and TGT (as mentioned earlier).
GD is my top performing stock with an annualized total return of 37%. GD is also DivGro’s first home run stock. NKE currently yields 1.24%, way below what I normally require. However, the company’s dividend growth rate is impressive (2), and with a dividend payout ratio below 30%, NKE could afford to continue growing its dividend at a healthy pace.
TROW, CSCO, and QCOM made my list of 10 Dividend Growth Stocks for October 2016. TROW placed second after a stock I don’t (yet!) own. CSCO and QCOM placed ninth and tenth, respectively.
Recent Performance
One way to assess a stock’s recent performance is to plot the current price relative to its 52-week trading range:
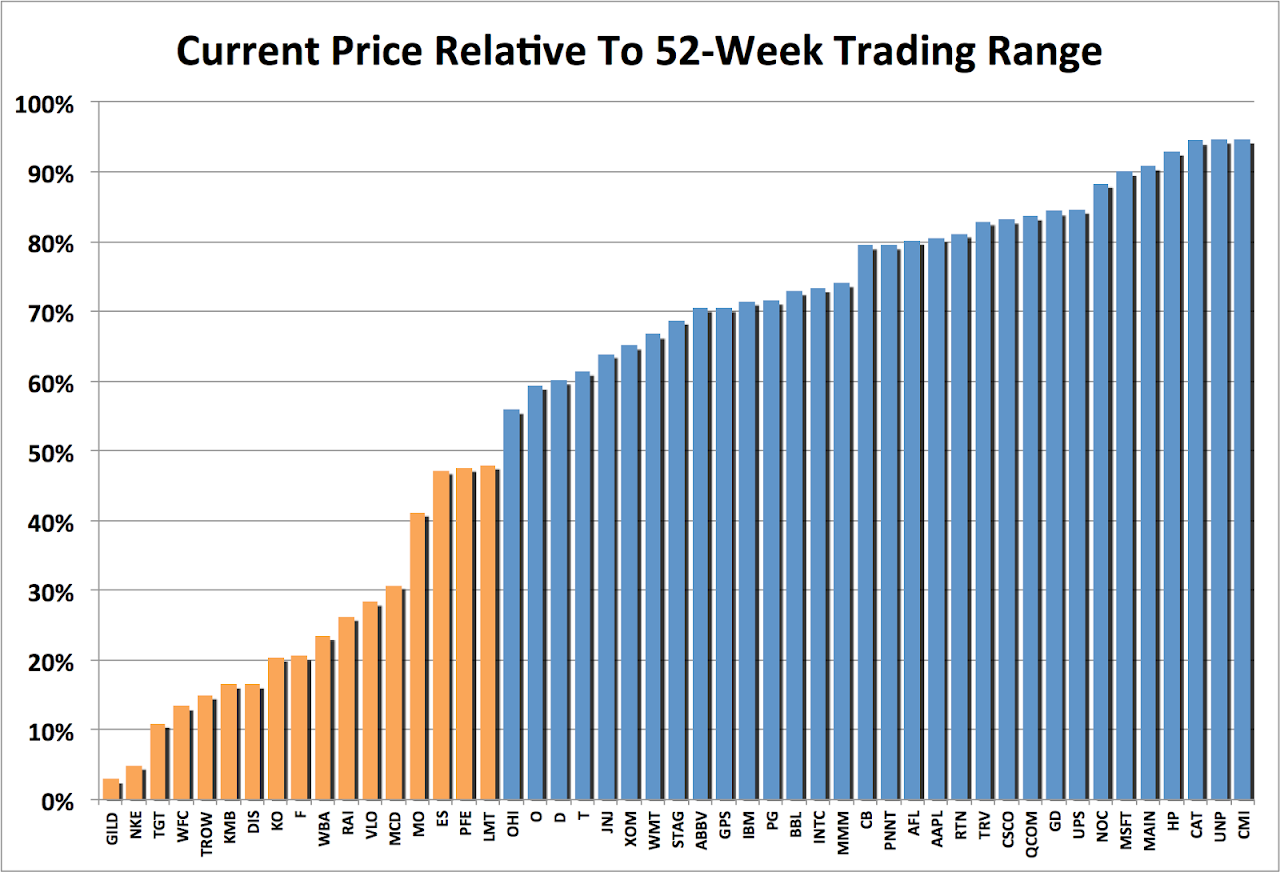 |
Stocks trading below the 50% mark are potentially are undervalued. The chart hides the magnitude of the trading range, but a quick check confirms that both GILD and NKE performed rather poorly over the past 52 weeks. GILD is down 28% and NKE is down 21%:
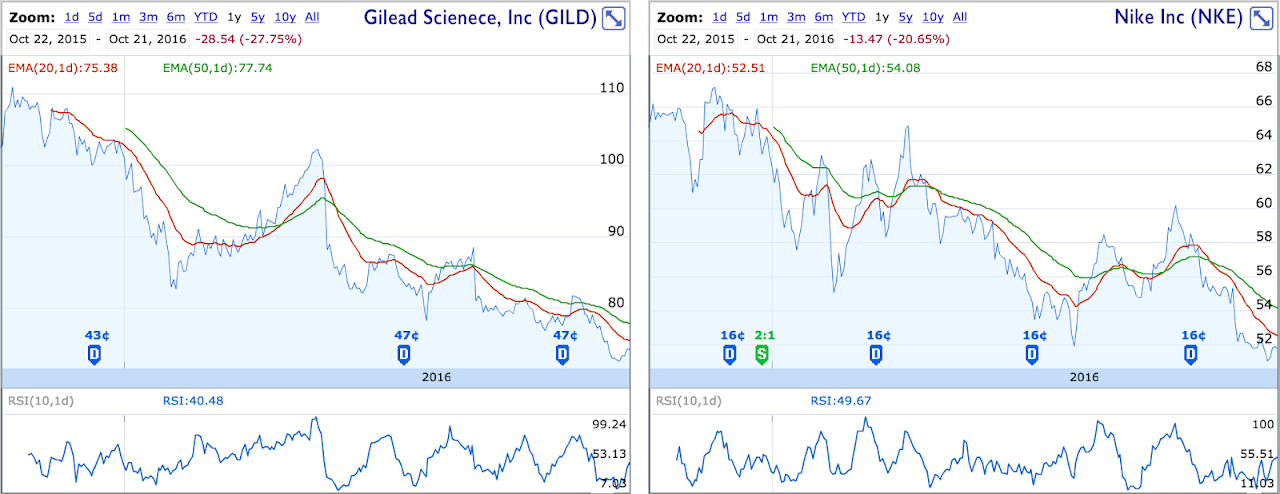 |
| Source: Google Finance |
Another way to look at a stock’s recent performance is to plot current yield relative to the 52-week yield range. For consistent dividend payments, a stock’s yield rises when the stock price drops, and vice versa. Dividend growth investors often look at current yield relative to average yield over a time frame. A higher current yield suggests that a stock may be undervalued.
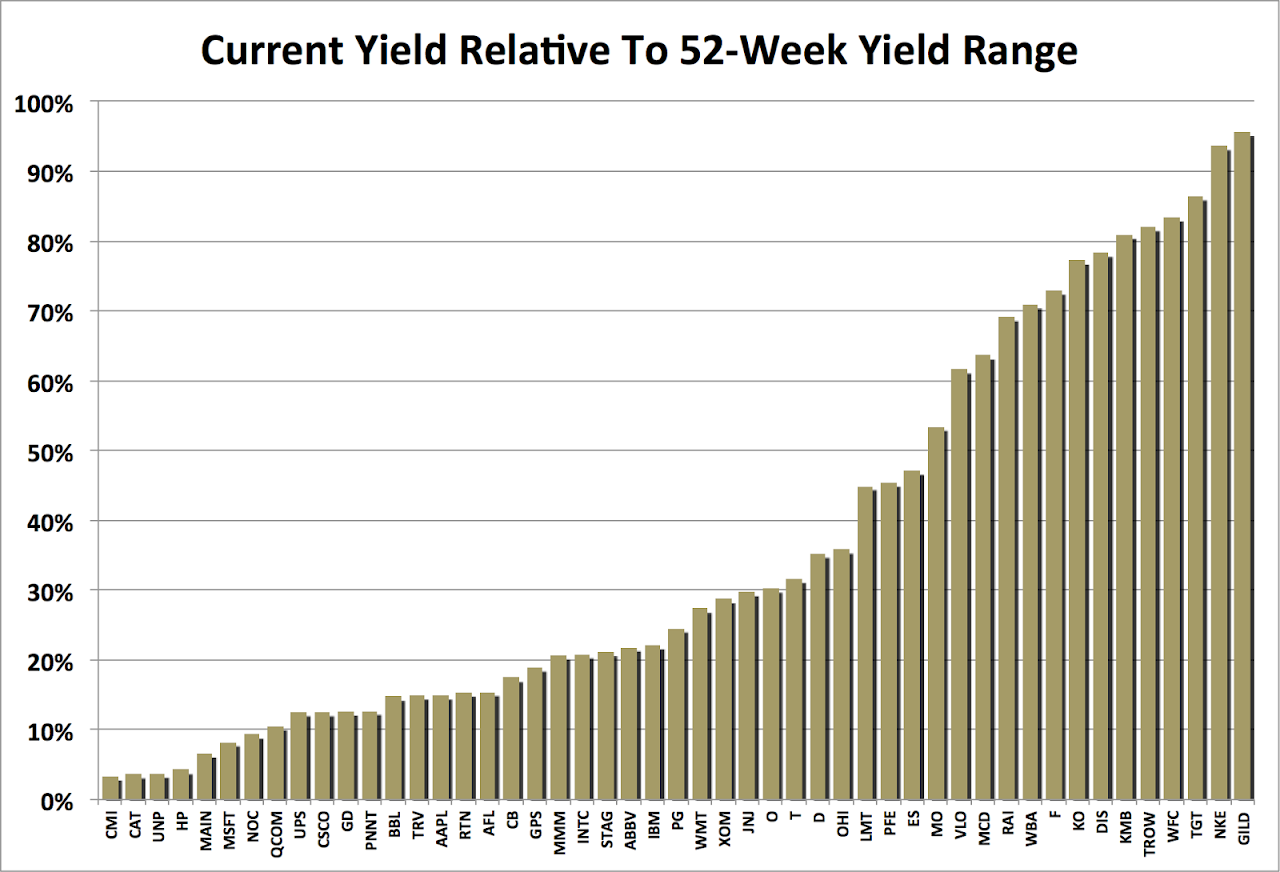 |
Because of the inverse price-yield relationship, the chart essentially reverses the order of the stocks. It is not an exact reversal, though. The reason is many stocks have experienced dividend increases over the past year.
Finally, I like to compare recent returns compare to annualized returns over a longer time frame. Doing so allows me to get a sense of each stock’s recent performance. The following chart compares 1-year returns to annualized 5-year returns for all my DivGro stocks. Note that dividends are not accounted for in this chart:
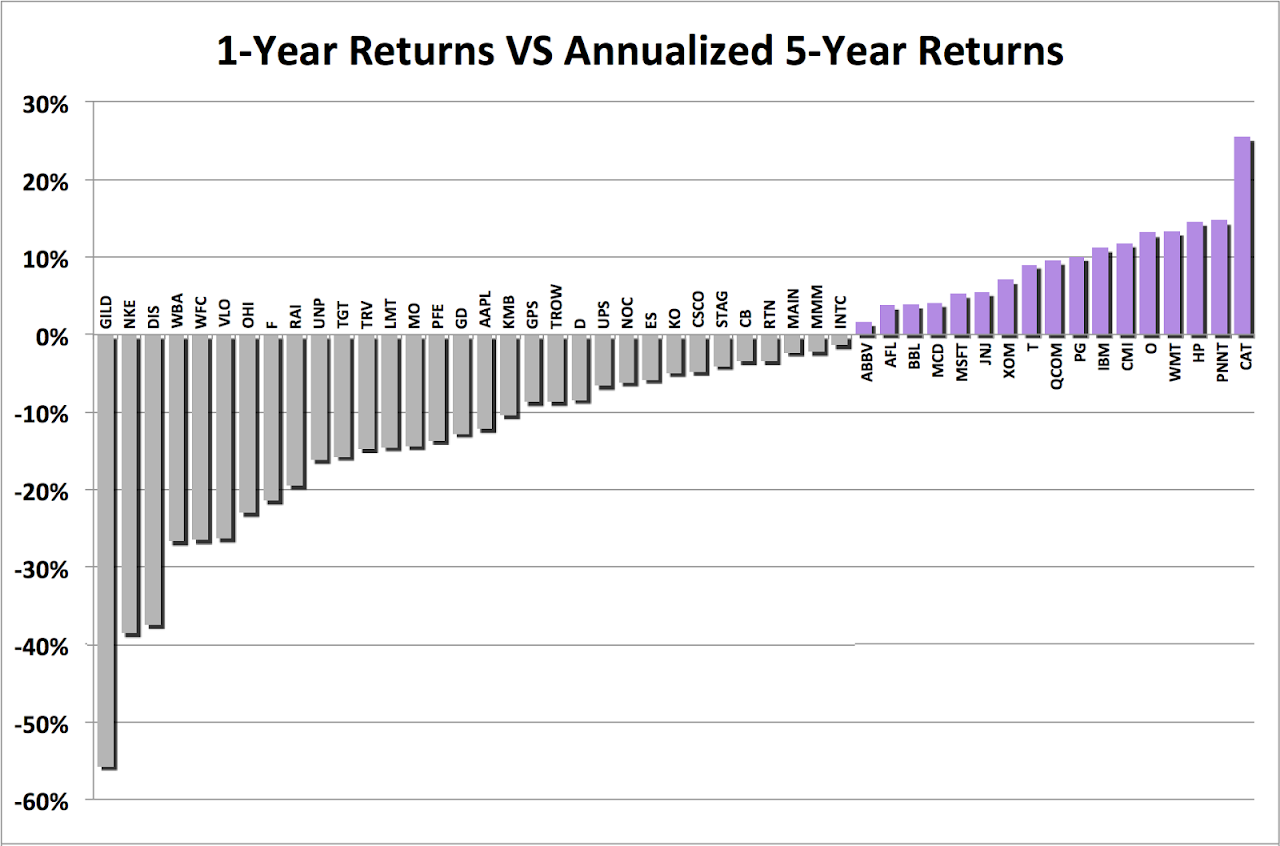 |
The chart confirms that GILD has been the worst performer over the past year, this time compared with its annualized performance over five years. In contrast, CAT is performing quite well relative to its annualized 5-year performance.
Positions To Close
I plan to sell the following stocks if conditions are right:
• BHP Billiton (BBL)
With an annualized loss of 11%, BBL is the worst performer of my long-term positions. It is rated 2-stars and ranked #48 out of 49 stocks. The company has cut the dividend twice in the past year, so BBL now yields only 1.99%. My plan is to sell BBL by year’s end and to offset capital gains. The stock is in an uptrend, so I’m waiting to see if I can reduce my losses a bit!
• Helmerich & Payne Inc (HP)
HP is rated 4-stars and ranked #38 out of 49 stocks. While HP yields an impressive 4.21%, I’m concerned about dividend safety in light of the company’s near-term outlook and the collapse of energy resource pricing. I’m close to breakeven, and if the stock price continues to improve, I should be able to sell my shares for a small profit before year’s end.
• PennantPark Investment (PNNT)
I’m happy to see a small profit in my PNNT position. In August, I confessed to significantly increasing my PNNT position in an attempt to recover past losses. With an unsustainable yield of nearly 15%, I don’t see PNNT as a long-term holding. It is ranked #49 out of 49 stocks in DivGro and is my only 1-star stock. PNNT just declared another 28¢ dividend, so I’ll hang onto my shares a little longer…
• Caterpillar Inc (CAT)
I think it is time to part ways with CAT. The stock has made a decent comeback in the past 52-weeks despite a 15% drop in revenue. I rate the stock 4-stars, but it is ranked #36 out of 49 stocks, and I’m concerned about the company’s near-term future (3). Revenue is expected to drop in 2017, and now the CEO has resigned after 43 years with the company. My CAT position shows annualized profits of 6%.
Positions To Boost
Based on the information presented here, I consider several stocks to be suitable for further investment. Please note that I’m not recommending these stocks. Readers should do their due diligence!
In the following descriptions, the yield is calculated on closing prices on 21 October 2016, payout is the EPS (earnings per share) payout ratio, and debt is the stock’s debt to equity ratio. I also include Morningstar’s moat rating and Standard and Poor’s credit rating. Value Line’s safety and financial strength ratings round things out.
• T. Rowe Price Group, Inc (TROW)
streak 30 years | 5-year growth rate 14% | yield 3.27% @ $65.96 | payout 52% | debt 0% |moat wide | credit rating N/A | safety 2 | financial strength A+
Dividend Champion
TROW is the top-ranked stock in my portfolio and the only 7-star stock. Trading at a 7% discount to fair value, I like the stock’s yield, dividend growth rate, and it’s zero debt. S&P Capital IQ gives TROW a Quality Ranking of A-.
streak 14 years | 5-year growth rate 20% | yield 3.12% @ $55.76 | payout 62% | debt 38% | moat narrow | credit rating A+ | safety 1 | financial strength A++
streak 6 years | 3-year growth rate 32% | yield 3.45% @ $30.15 | payout 49% | debt 45% | moat narrow | credit rating AA- | safety 2 | financial strength A++
• Valero Energy Corporation (VLO) streak 36 years | 5-year growth rate 56% | yield 4.30% @ $67.93 | payout 39% | debt 36% | moat narrow | credit rating BBB | safety 3 | financial strength A+
Thanks for reading and take care, everybody!
Note: FerdiS manages and writes about DivGro, his portfolio of dividend growth stocks created in January 2013. Please visit divgro.blogspot.com.
Additional Links:
(1) http://www.wsj.com/articles/wells-fargo-profit-slides-as-bank-battles-to-restore-reputation-1476446682
(2) http://divgro.blogspot.com/2016/07/recent-buy-nike-inc.html
(3) http://seekingalpha.com/news/3214453-cat-ceo-oberhelmans-early-departure-warning-analysts-say


