Update on 3.9/20: In a sign of how volatile times are, over the weekend, oil prices plummeted to close to $30, the treasury bond rate to less than 0.4% and the market looks set to drop substantially. A work in progress indeed….
I wrote a post on how the Corona Virus was playing out in markets on February 26, two days into the market going into convulsions, and while I tried to make an assessment of the value effect, I also said that this analysis was a work in progress, that I would revisit as we learned more about the virus and its economic consequences. Eleven days later, we still don’t have clarity on the health or economic effects of the virus, but we do have substantially more data on what the market reaction has been. In this post, I will begin by doing a quick update on the viral spread across the world, but spend more time on the market damage, looking at where it has been greatest, seeking clues for the future.
A Virus Update
In the last week and a half, the virus has clearly expanded its global footprint, with Italy and South Korea now in the front lines, in terms of exposure, but with the numbers climbing rapidly across the rest of the world, it is clearly now on its way to becoming a global pandemic.
NY Times, as of March 6, 2020
While the word “pandemic” alone is often enough to drive us to panic, it is not the first, nor will it be the last, and it helps to gain perspective to compare it to pandemics in the past, both in terms of contagion and health consequences. This chart from the New York Times reflects what we know about the virus as of February 28, 2020:
Note that the large band of uncertainty around the fatality rate related to the virus, reflecting how little we know about its potential consequences and how it measures up against other viruses in terms of contagion. Put simply, this is not just the common flu with side effects, as some have argued, but it is perhaps not the deadly killer that others at the other extreme has painted it as. The X factor that makes this virus potentially more difficult to contain and more likely to have global consequences is globalization, one more argument that populists will undoubtedly use to argue against it. The reality is that travel, especially across borders and continents, is not only easier than ever before but also more affordable, as income levels rise in the developing world. Over the next few weeks, it is likely that we will see the case numbers rise dramatically in countries which have been hitherto exposed only lightly to the virus, the fatality numbers will rise among those affected, and health systems around the world will come under pressure.
A Market Update
Over the last three weeks, we have had a glimpse of how quickly market moods can shift. Looking at the major US equity indices, you can see the euphoria that resulted in the market peaking on February 12, 2020, not only faded quickly but has been replaced with panic and desperation:
If there is one thing that can be said about markets during this tumultuous period, they were not playing favorites, since all of the indices registered double git drops, with the NASDAQ showing the smallest drop.
a. Melting Away – Dollar Value Lost
The focus on the indices can obscure the staggering decline in market values that occurred in a three-week period and in the table below, I chronicle the loss in market value globally, broken down by region.
The first four columns look at total market capitalization and the change in both dollar and percentage terms between February 14, 2020 and March 6, 2020. Globally, equity markets lost $7.3 trillion in value over this three-week period, and it is ironic that China, the starting point for the Corona Virus, is the only part of the world where stocks have collectively seen an increase in market capitalization. That can be explained perhaps by the fact that Chinese stocks had already registered drops in the weeks leading into February 14, and that the rest of the world is playing catch up. The last five columns look at the percentage change in individual stocks to illustrate how widely the pain was felt. In ten of the twelve regions, with China and Africa being the exceptions, less than 25% of stocks went up during the three week period. In most of the markets, the percentage change in overall market capitalization is similar to the percentage change in the median stock, indicating that this is not a decline being caused by a subset of stocks being hit with extreme price movements.
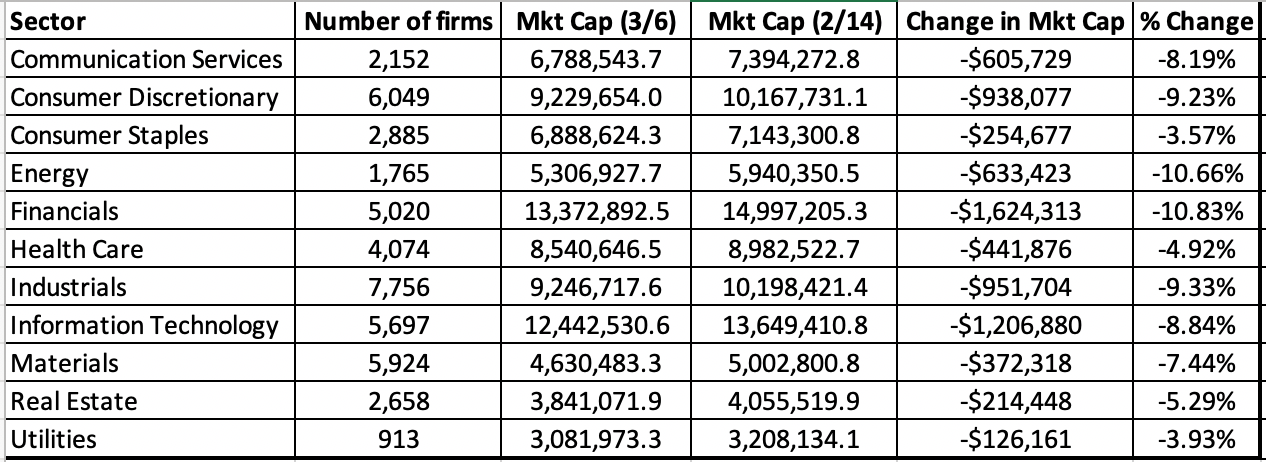
b. The Sector/Industry Breakdown
There is no question that the virus not only has the potential to hurt the global economy, but the hurt will be felt disproportionately by companies in different businesses. To assess how the market has repriced different sectors, I look at the market capitalization lost, in both dollar and percent terms, by sector, for global companies:
The biggest losers were energy and financial service companies, and the sectors that performed the best were utilities, health care, real estate and consumer staples. Breaking down the sectors into more detail, I looked at US stocks, by industry, and the following is the list of the five worst and five best performing industries between February 14 and March 6:
The full list is available for download by clicking here. For anyone who has been following the news stories of airlines scrambling to cancel flights and mollify passengers and hotels dealing with cancellations, it should come as no surprise that aviation and hotel stocks were the worst performing industry groupings, followed by oil, broadcasting and life insurance. The best performing industry grouping also carries no surprises, with precious metal companies benefiting from the rise in gold prices, grocery retailers and tobacco drawing on their strengths as non-discretionary products and biotech companies benefiting from the focus on a solution for the virus.
c. Size Classes
The conventional wisdom, when there is a market crisis, is that investors move their money to safety. While that has clearly happened with money shifting into US treasuries, the question is whether investors are abandoning smaller companies for larger ones, presumably driven by the perception that smaller companies are riskier than larger ones. To answer this question, I looked at all global companies, broken down by market capitalization into ten classes:
The results don’t line up with expectations, as small companies saw a small increase in overall market capitalization and large cap stocks registered the largest decline. It is worth noting that even among the smallest stocks, the median stock lost 7.73%, suggesting that the increase in value is coming from a small percentage of stocks in the group. (Looking at just US stocks, you get very similar results.)
d. Value and Momentum Classes
The drop in the market has provided some measure of vindication to those who have long been arguing that the market is over priced, but while the fact that the market was priced so richly set it up for a larger fall, breaking down the decline in market cap into classes can provide us some insight into whether the stocks that had gone up the most were the ones that saw the biggest drop off in value between February 14 and March 6. In the table, we break global stocks down into ten classes based upon the price change in the year prior to February 14 and look at the change in market capitalization, by class:
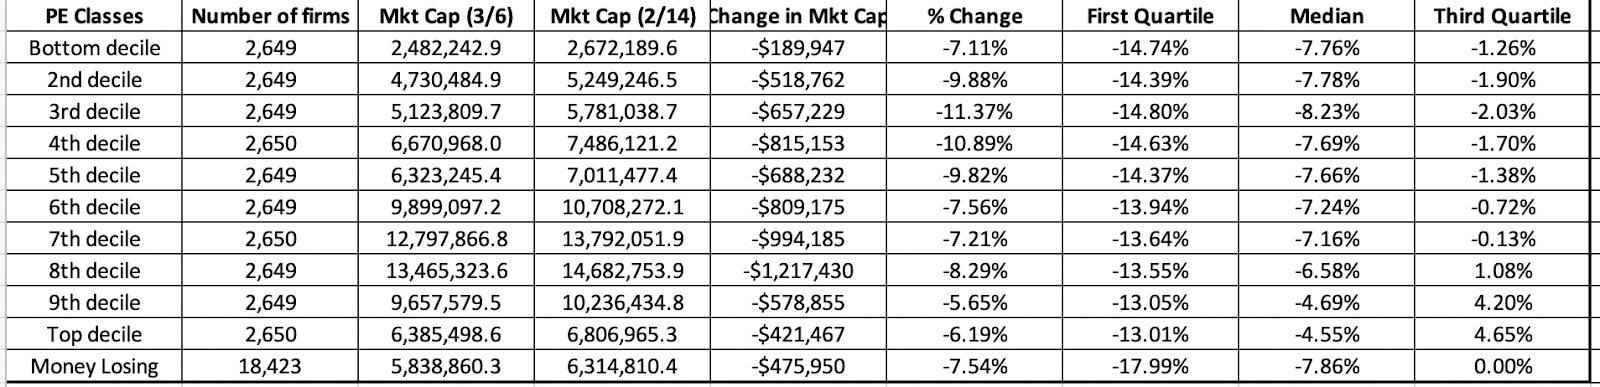
In keeping with the story that what goes up the most must come down the most, you find that stocks that had performed the worst in the year leading into February 14 had an increase in market capitalization, though the median stock was still down, within this group. Using another proxy for rich pricing, I also broke stocks down by PE ratio classes from lowest to highest, based upon market capitalization on February 14, 2020, and looked at the change in market value between February 14 and March 6:
Here, the evidence contradicts the market correction hypothesis, since there is no discernible relationship between PE ratios and market value change. In fact, the best performing stocks are in the top two deciles of PE ratios.
e. The Rest of the Story
One of the perils of getting focused on equity markets is that you can miss all of the action in other markets, and the changes in those markets can not only help augment the story that equities are telling us, but they can yield insight into other facets.
I. US Treasury rates
If the drop in stock prices over the last three weeks took your breath away, the shifts in the treasury market were even larger and more unsettling:
The 10-year US T.Bond dropped below 1% for the first time in history on March 3 and continued trending down to settle at 0.74% on March 6. In tandem, the other treasuries also dropped, bring the US dollar risk free rates closer to the Euro and Yen risk free rates. While some of the decline in rates can be attributed to a flight to safety, there is also a much depressing read of the same drop. To the extent that long term risk free rates are proxies for nominal economic growth, the treasury bond market seems to be signaling not just a shock to near-term economic growth from the Corona virus, but a long term decline. We will get a better sense of what the bond market is expecting, once equities settle in, but if the 10-year rate stays below 1%, it is not a good sign for the economy.
II. Gold and Bitcoin (Millennial Gold)
The other asset class that always attracts attention and money during crisis is gold, and for good measure, I will also look at Bitcoin, which some have suggested is the millennial equivalent of gold:
It is perhaps a little unfair to draw a conclusion from just contest, but the fact that Bitcoin has behaved more like stocks than like gold suggests that millennials who have held on to it, as their asset of refuge, may want to rethink their positions.
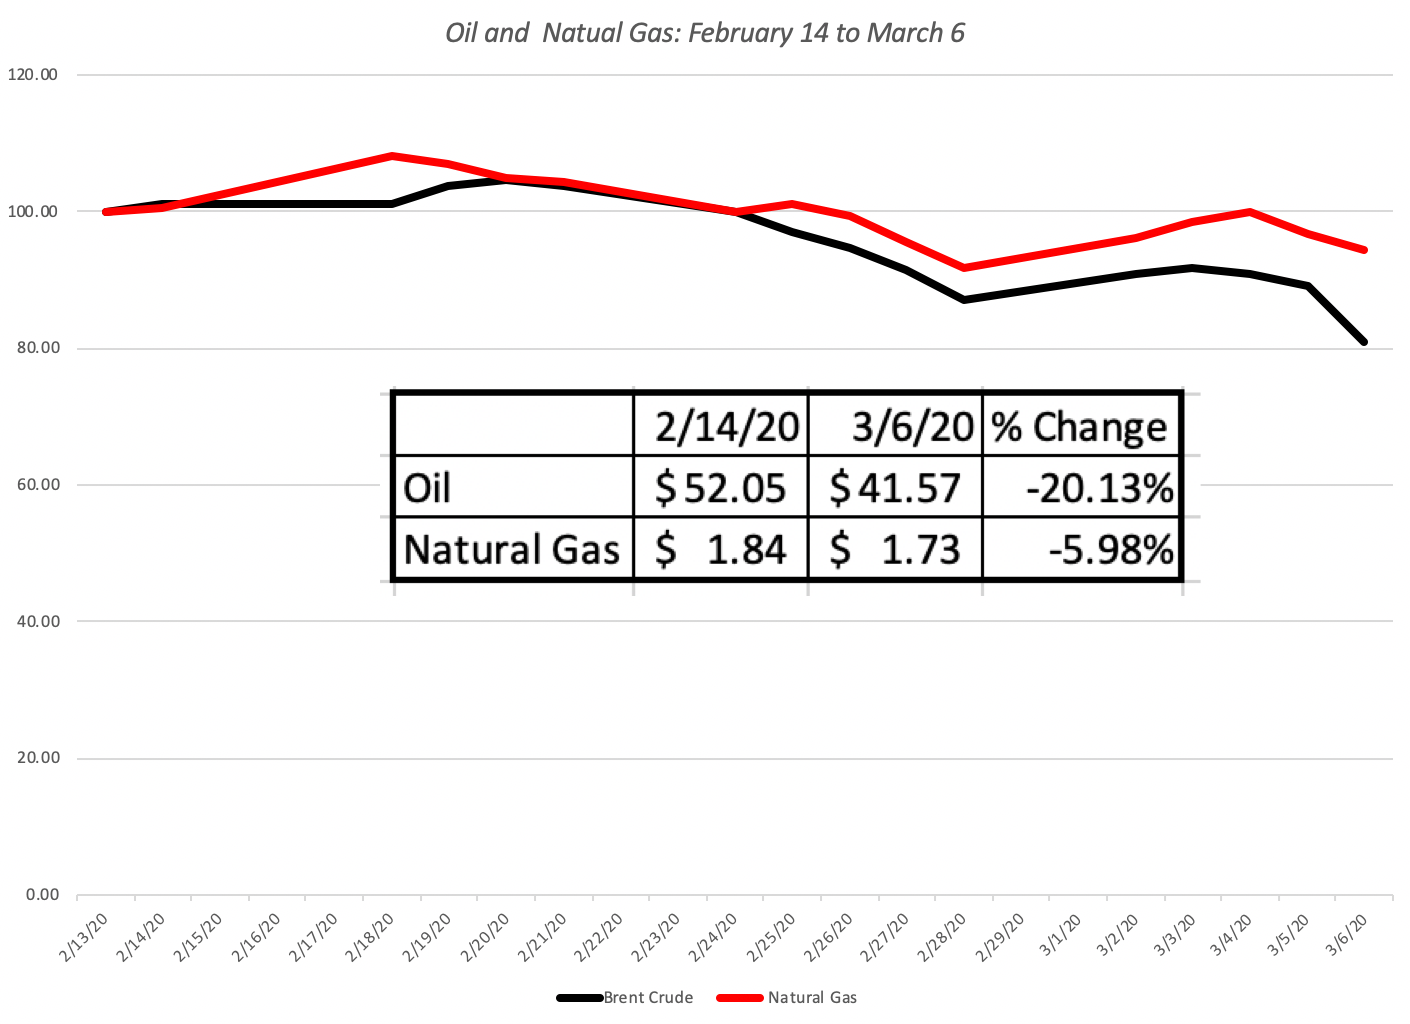
3. Oil and Commodities
The final piece of the market puzzle comes from the commodity markets, with oil as its front runner. In the three weeks which have taken equity markets on a ride and caused US treasuries to hit new lows, oil prices have been on a journey of their own:
Not only have oil prices dropped 20% during the three weeks, they are plumbing depths seldom seen in this century. The decline in oil prices not only reflect an expectation of global economic slowdown but also how dependent oil and other commodity prices have become on China’s continued growth and prosperity. The smaller decline in natural gas prices, much less tied to the Chinese market, reinforces this argument.
Revisiting the Viral Value
With this long lead in, you might have lost interest already, but if you are still reading, it is time to turn to specifics and look at how what I have learned in the last 12 days has or has not changed my views on the market.
Recapping the Drivers
Very quickly recapping what I argued were the drivers of the value of stocks, I argued that there were three components to value:
Earnings Growth: In my 2/26/20 valuation of the S&P 500 index, I argued that the corona virus is now almost certain to cause earnings effects for companies, and estimated the drop to be 5% (a significant revision down from the 5.52% growth that had been predicted in the index. In the last few days, analysts have started adjusting earnings expectations down for companies, and this snapshot from Zacks today captures some of the adjustment:
Note that the expected earnings on the index for 2021 has dropped from 172 for next year, two weeks ago, to 163 this week, matching the earnings generated in 2019. That is still better than the 5% drop that I was projecting, but my guess is that I am still undershooting the actual earnings decline and I have increased the expected earnings drop in 2020 to 10%. To complete the assessment of growth, I also need to estimate how much of the earnings drop in 2020 will be recouped in future years. In my valuation on February 26, I had estimated that half of the earnings drop in 2020 would be recouped but that the rest would be lost for the long term. I will continue to hold on to that assumption In addition, since my long term growth rate converges on the US T.Bond rate, the precipitous drop in that rate has lowered my growth rate in perpetuity to 0.74% (to match the T. Bond rate).
Cash flow Payout: The second component of value is the cash that companies can return, in dividends and buybacks. I assumed that companies, driven by uncertainty, would scale the percent of the earnings that they return to stockholders from the 92.33% that they were returning prior to the crisis to 85%, more in line with the ten-year average. In the days since, there have been no announcements of dividend cuts or scaling back of already announced buybacks, but I would not be surprised to see that change in the next few weeks.
Discount Rate Dynamics: The discount rate dynamics are the trickiest. On the one hand, the lower T.Bond rate will create a lower base from which to build up, but the increase in volatility (actual and expected, as captured in the rise in the VIX over the last three weeks) has pushed equity risk premiums up. I will scale up my ERP to 5.69% to match my implied premium at the start of March 2020.
With that combination of assumptions (10% drop in earnings, 50% recoupment between 2022-25, 85% cash return and a 5.69% premium), the value that I derive fo the index Is 2889, and much of the reason for the drop from the value that I estimated on February 26, 2020, can be attributed to the the lower growth rate that I am estimating in the near term and in the long term.
Value Dynamics
In the days to come, there will be more information that comes out about not only how the virus is spreading across the globe but also on its consequences for businesses and economies. To provide a measure of how this will affect stock values, I computed the value of the S&P 500 (which stood at 2972.37 on March 6, 2020) as a function of what I believe are the two big uncertainties; the effect that the virus will have on earnings in 2020 and how much it will affect long term earnings growth:
Note that the big concern, if you are an investor focused on value, is not how much the Corona virus will affect earnings this year, but how much of that earnings drop is permanent. If you are in the camp that believes that there will be an earning drop, but that it will be fully recouped, stocks look cheap even if earnings drop by 20% in 2020. Conversely, if you believe that this earnings drop is likely to be permanent, with none of the drop being recouped, the value drop will be more closely linked to the earnings drop and suggests that there is more pain ahead for the market.
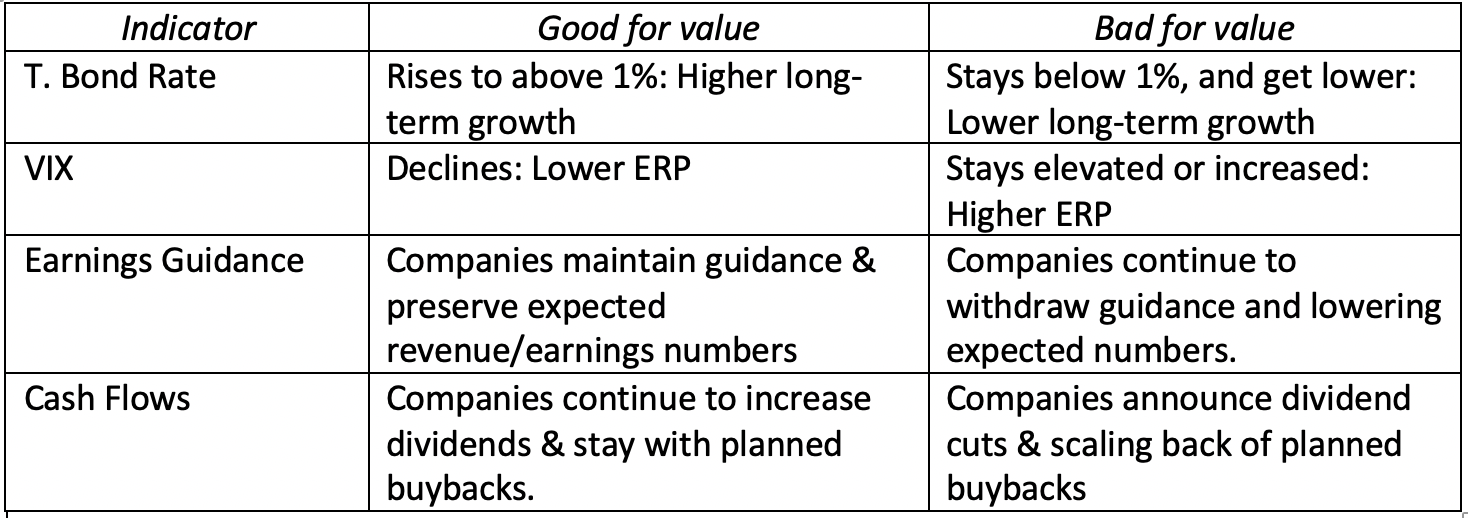
What to watch for..
Needless to say, there will be plenty of distractions in the coming weeks, but my suggestion is that you stay honed in on the value determinants, screening news stories for consequences for these determinants. In particular, I plan to watch the following developments:
I know that my view that T.Bond rates staying low and getting lower is not a positive but a negative for stocks puts me in the opposite camp from those who believe that the Fed will be the savior. When rates are as low as they are, central banks are more helpless bystanders than powerful trend setters, and the message about future growth that is imputed in low rates more than drowns any short term positive effects.
The Big Things in Life
As I write this analysis of how the virus can affect stock market values and portfolio returns, I am aware that there is a human toll that it is taking that makes any market effects seem trivial. If I were given the choice, I would trade a large market drop for a small loss of lives and a quick passing of the virus. At times like these, I am reminded again of the fragility of life and the importance of good health and family. Be well, Godspeed and please wash your hands!
Co-Founder and Research Director at Insider Monkey
When Jeff Bezos said that one breakthrough technology would shape Amazon’s destiny, even Wall Street’s biggest analysts were caught off guard.
Fast forward a year and Amazon’s new CEO Andy Jassy described generative AI as a “once-in-a-lifetime” technology that is already being used across Amazon to reinvent customer experiences.
At the 8th Future Investment Initiative conference, Elon Musk predicted that by 2040 there would be at least 10 billion humanoid robots, with each priced between $20,000 and $25,000.
Do the math. According to Musk, this technology could be worth $250 trillion by 2040.
Put another way, that’s roughly equal to:
175 Teslas
107 Amazons
140 Metas
84 Googles
65 Microsofts
And 55 Nvidias
And here’s the wild part — this $250 trillion wave isn’t tied to one company, but to an entire ecosystem of AI innovators set to reshape the global economy.
It’s a leap so massive, it could reshape how businesses, governments, and consumers operate worldwide.
Even if that $250 trillion figure sounds ambitious, major firms like PwC and McKinsey still see AI unlocking multi-trillion-dollar potential.
How could anything be worth that much?
The answer lies in a breakthrough so powerful it’s redefining how humanity works, learns, and creates.
And this breakthrough has already set off a frenzy among hedge funds and Wall Street’s top investors.
What most investors don’t realize is that one under-owned company holds the key to this $250 trillion revolution.
In fact, Verge argues this company’s supercheap AI technology should concern rivals.
Before I reveal the details, let’s talk about how some of the richest people on the planet are positioning themselves.
Bill Gates sees artificial intelligence as the “biggest technological advance in my lifetime,” more transformative than the internet or personal computer, capable of improving healthcare, education, and addressing climate change.
Larry Ellison — through Oracle, is spending billions on Nvidia chips and partnering with Cohere to embed generative AI across Oracle’s cloud and apps.
Warren Buffett — not known for tech hype — says this breakthrough could have a ‘hugely beneficial social impact.
When billionaires from Silicon Valley to Wall Street line up behind the same idea — you know it’s worth paying attention to.
Even as we admire what Tesla, Nvidia, Alphabet, and Microsoft have built, we believe an even greater opportunity lies elsewhere…
But the real story isn’t Nvidia — it’s a much smaller company quietly improving the critical technology that makes this entire revolution possible.
And judging by what I’m hearing from both Silicon Valley insiders and Wall Street veterans…
This prediction might not be bold at all:
A few years from now, you’ll wish you’d owned this stock.
The best part? You can discover everything about this company and its groundbreaking technology right now.
I’ve compiled everything you need to know about this groundbreaking company in a detailed, members-only report.
Trust me — you’ll want to read this report before putting another dollar into any tech stock.
For a ridiculously low price of just $9.99 a month, you can unlock a year’s worth of in-depth investment research and exclusive insights – that’s less than a single fast food meal!
Here’s why this is a deal you can’t afford to pass up:
• Access to our Detailed Report on this Game-Changing AI Stock: Our in-depth report dives deep into our #1 AI stock’s groundbreaking technology and massive growth potential.
• 11 New Issues of Our Premium Readership Newsletter: You will also receive 11 new issues and at least one new stock pick per month from our monthly newsletter’s portfolio over the next 12 months. These stocks are handpicked by our research director, Dr. Inan Dogan.
• One free upcoming issue of our 70+ page Quarterly Newsletter: A value of $149
• Bonus Reports: Premium access to members-only fund manager video interviews
• Ad-Free Browsing: Enjoy a year of investment research free from distracting banner and pop-up ads, allowing you to focus on uncovering the next big opportunity.
• 30-Day Money-Back Guarantee: If you’re not absolutely satisfied with our service, we’ll provide a full refund within 30 days, no questions asked.
If you’re thinking about getting in, don’t wait – because once Wall Street catches wind of this story, the easy money will be gone.
Space is Limited! Only 1000 spots are available for this exclusive offer. Don’t let this chance slip away – subscribe to our Premium Readership Newsletter today and unlock the potential for a life-changing investment.
Here’s what to do next:
1. Subscribe to our Premium Readership Newsletter for just $9.99 a month. (33% Off – was $14.99).
2. Enjoy a year of ad-free browsing, exclusive access to our in-depth report on the revolutionary AI company, and the upcoming issues of our Premium Readership Newsletter over the next 12 months.
3. Sit back, relax, and know that you’re backed by our ironclad 30-day money-back guarantee.
Don’t miss out on this incredible opportunity! Subscribe now and take control of your AI investment future!
Co-Founder and Research Director at Insider Monkey
My name is Inan Dogan. I’m the co-founder and Research Director of Insider Monkey. I have an important message for you today.
Since March 2017, my stock picks have returned 16.5% annually. Today, I’ve found an opportunity even bigger than my British American Tobacco call.
Two years ago, Wall Street wrote off British American Tobacco (BTI) as a “melting ice cube.” The stock had crashed 40% from its peak, and consensus said the business was dying.
We looked under the cover and realized they were wrong.
We alerted our subscribers, and BTI returned 90% in just 16 months.
Now if you had invested just $10,000 in BTI in June 2024, you’d be sitting on $19,000 in October 2025.
Today, we have identified a nearly identical pattern in a digital-first giant trading at $3.
While the market panics over a surface-level revenue decline, our PhD-led research shows management has actually surgically cut $100 million in waste to focus on high-margin growth.
This pattern is a hallmark of our 16.5% annual return track record. The current opportunity offers a 400% upside potential—dwarfing even our 90% BTI return.
Get the ticker for our new “Underdog” pick and the full BTI case study for just 99 cents.
This exclusive offer is for NEW newsletter subscribers ONLY! Join our Premium Readership Newsletter for only $0.99 and become part of a savvy investor community.!
This offer vanishes in 7 days, so don’t miss your chance to lock in market beating returns! Sign up NOW! The monthly newsletter comes with a 30-day, no-risk money-back guarantee. This offer is available to the first 1000 new investors who respond.
Here’s why this is a deal you can’t afford to pass up:
Access to our Detailed Report on this $3 stock with 400% upside potential.
BONUS REPORT on our #1 AI-Robotics Stock with 10000% upside potential: Our in-depth report dives deep into our #1 AI/robotics stock’s groundbreaking technology and massive growth potential.
One New Issue of Our Premium Readership Newsletter: You will also receive one new issue per month and at least one new stock pick per month from our monthly newsletter’s portfolio over the next 12 months. These stocks are handpicked by our research director, Dr. Inan Dogan.
One free upcoming issue of our 70+ page Quarterly Newsletter: A value of $149
Bonus Content: Premium access to members-only fund manager video interviews
Ad-Free Browsing: Enjoy a month of investment research free from distracting banner and pop-up ads, allowing you to focus on uncovering the next big opportunity.
Lifetime Price Guarantee: Your renewal rate will always remain the same as long as your subscription is active.
30-Day Money-Back Guarantee: If you’re not absolutely satisfied with our service, we’ll provide a full refund within 30 days, no questions asked.
Space is Limited! Only 1000 spots are available for this exclusive offer. Don’t let this chance slip away – subscribe to our Premium Readership Newsletter today and unlock the potential for a life-changing investment.
Here’s what to do next:
1. Head over to our website and subscribe to our Premium Readership Newsletter for just $0.99.
2. Enjoy a month of ad-free browsing, exclusive access to our in-depth report on the Trump tariff and nuclear energy company as well as the revolutionary AI-robotics company, and the upcoming issues of our Premium Readership Newsletter.
3. Sit back, relax, and know that you’re backed by our ironclad 30-day money-back guarantee.
Don’t miss out on this incredible opportunity! Subscribe now and take control of your AI investment future!


 Note that the expected earnings on the index for 2021 has dropped from 172 for next year, two weeks ago, to 163 this week, matching the earnings generated in 2019. That is still better than the 5% drop that I was projecting, but my guess is that I am still undershooting the actual earnings decline and I have increased the expected earnings drop in 2020 to 10%. To complete the assessment of growth, I also need to estimate how much of the earnings drop in 2020 will be recouped in future years. In my valuation on February 26, I had estimated that half of the earnings drop in 2020 would be recouped but that the rest would be lost for the long term. I will continue to hold on to that assumption In addition, since my long term growth rate converges on the US T.Bond rate, the precipitous drop in that rate has lowered my growth rate in perpetuity to 0.74% (to match the T. Bond rate).